

After the audit
Clear ownership
Every dataset has a named owner. Every process has a documented SOP.
Before the auditNo one owns the dataset.We help mid-market and private equity companies between $30M and $500M ARR turn fragmented CRM, marketing, and finance data into a single, forecastable revenue engine, by auditing the six pillars that actually drive pipeline.
Trusted by revenue teams at
A Breakthrough in RevOps Measurement. Built for Commercial Use.
The Gap
Different seats describe the same underlying failure: a revenue engine no one team can see end to end. These are the patterns leadership teams describe on the first call, before we plug into a single system.
Dashboards show different answers depending on the tool. Manual cleanup becomes a weekly task for the RevOps team.
Marketing reports 400 MQLs. Sales says 60 were real. You're both reading the same CRM. Neither of you can explain the gap without a three-day data pull.
Stage definitions drift by rep. Pipeline coverage looks healthy in aggregate and thin under inspection.
Who this is for
Stage-by-Stage Loss
Scoring thresholds are edited without version control, so the qualified population changes shape between quarters while the reported conversion rate stays flat.
-31%Routing latency and unenforced acceptance criteria leave qualified records unworked. The loss is recorded as low lead quality rather than an operational gap.
-22%Stage exit criteria are documented in policy but not constrained in the object model, so aging deals remain forecast-eligible until the quarter closes against them.
-14%Maturity Model
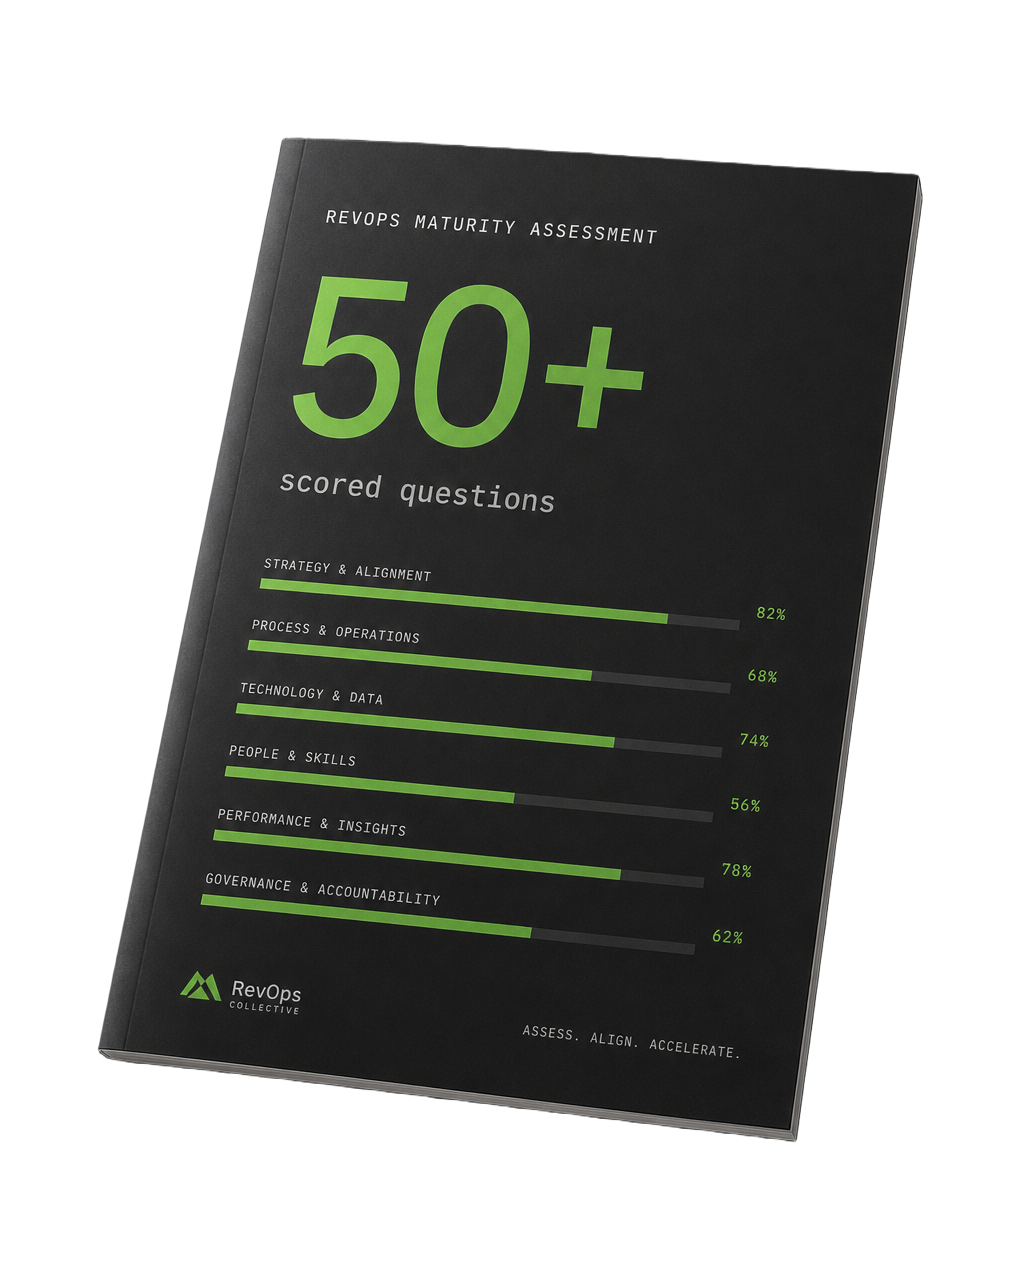
Every audit produces a stage per pillar and an overall score: comparable, defensible, repeatable quarter over quarter.
Reports rebuilt monthly. Data owned by no one. Every metric has three answers.
First shared definitions appear. Reconciliation is still manual and reactive.
Most companies start hereCross-team taxonomies agreed. Handoffs improving, forecast still directional.
Instrumented lifecycle. Forecast within tolerance. FP&A linked to pipeline.
Live systems. Board-grade signal. Predictable revenue engine.
Audit builds your path to hereOur Method
A structured 5-stage assessment across six pillars. Same framework every time, so results are comparable, defensible, and actionable.
Stakeholder interviews with RevOps, Marketing Ops, Sales Ops, and FP&A. We map what actually happens, not what the process doc says.
Hands-on review of your CRM, MAP, ERP, analytics, and warehouse. We score six audit pillars on a 1 to 5 rubric with evidence attached to every score.
You receive a maturity stage per pillar and overall: Chaotic, Emerging, Developing, Functional, or Optimized. No opinions, just the rubric.
We rank gaps by revenue impact and effort. Three priorities for the next 90 days. Longer-term opportunities for months 3 to 12.
We don't hand you a PDF and leave. We stay for the build: integrations, data models, dashboards, process rollout. With action plan, and step-by-step roadmap created in collaboration with your team to ensure it's realistic. Then, we can dive into implementation.
What We Audit
How well your CRM, MAP, ERP, HRIS, and analytics tools connect and share data.
Whether metrics are defined the same way across every team.
Whether your data can actually support a forecast.
Whether campaigns, lead flows, and handoffs run the same way twice.
Whether your dashboards are trusted, automated, and consistent.
Whether you have the people and bandwidth to run the system.
The FP&A x Marketing Data Readiness & RevOps Maturity Assessment: the same instrument we run inside the audit, including the scoring rubric and the five-stage maturity model.
The Promise

MQL, SQL, pipeline stage, CAC, and CLV mean the same thing in Marketing, Sales, CS, and Finance. Written down. Enforced in the system.
Before the auditDefinitions differ by team.Every dataset has a named owner. Every process has a documented SOP.
Before the auditNo one owns the dataset.
Visitor to Lead to MQL to SQL to Opportunity to Closed-Won, tracked end to end without a manual export.
Before the auditThe funnel is stitched by hand.
CAC, CLV, payback period, and pipeline contribution modeled from source data, not assumptions.
Before the auditThe forecast rests on assumptions.
Prioritized 90-day fixes plus a 3 to 12 month build plan, scoped and sequenced.
Before the auditFindings arrive as a report.Deliverables
Your score across all six audit pillars, mapped to a stage from Chaotic to Optimized. Every score backed by evidence.
6 pillars · 1 to 5 rubricA structured list of every gap blocking FP&A from linking spend to revenue, ranked by impact.
Ranked by revenue impactThree fixes, scoped and sequenced, with the expected impact of each.
3 fixes · 90 daysThe longer build: warehouse, automated CAC/CLV modeling, lifecycle standardization.
3 to 12 months, sequencedEvidence
A series of audits across EnviroKlenz's CRM, marketing, and sales tooling, then one connected system: Apollo.io, LinkedIn Sales Navigator, 8x8 calling, and Microsoft Teams integrated directly into HubSpot as the single system of record. Lead scoring thresholds (MQL, SQL, Opportunity, Cold, Disqualified), deal progression, and renewals moved from hand-tracking to automated workflows across two pipelines. Reporting went from thin visibility to a full suite: activity overview, pipeline progression, lead source analysis, deal aging, lost deal analysis, and forecasting, rolled up into holistic leadership dashboards. Email deliverability issues, weak send rates and alias confusion, were resolved as part of the engagement.
Audited six pillars across a mid-market portfolio company. Rebuilt the lifecycle model and gave the board a single, defensible number after months of reconciliation debates.
Three days of manual reconciliation replaced with warehouse-native CAC and pipeline dashboards, refreshed straight from the source systems.
Who This Is For
Outcomes
Median movement across engagements, measured against the pre-audit baseline we capture in week one.
Median lift in forecast accuracy within one quarter
Faster mean time from question to answer in board reporting
Reduction in reported-vs-actual pipeline variance
Testimonials
When it comes to a high-scale revenue delivery initiative, DevriX gets the job done, period. They quickly jumped in on a partially-started project and led it to completion in record time. They worked with our team to iron out the finer details while building the full picture. Communication, attention to detail, and attentiveness were all 5-star. Stellar work.
They bring a spirit of collaboration to their work, as well as taking initiative on virtual project management. It's extremely rare to work with a firm that has both development and business revenue chops. One remarkable thing: I have never met the DevriX team. We have never even spoken on the phone or VoIP. Another member of our team has spoken with them, but the point is I've been able to get projects done with DevriX that involved complex design requirements without ever talking real-time. That requires an exceptional attention to detail. I cannot recommend DevriX highly enough.
The audit is built to make an in-house RevOps lead or partner more effective, not to replace them. We bring an outside diagnostic across data, CRM, marketing ops, and finance systems, then hand your team a prioritized backlog they own. Most engagements end with your RevOps function stronger, better resourced, and clearly scoped, not sidelined.
A freelancer fixes the thing you asked them to fix. We audit the thing you didn't know was broken. RevOps failures are cross-functional by definition: marketing attribution breaks because the CRM lifecycle field is wrong, which breaks the forecast. One person in one tool can't see that.
They'll advise. We execute. A consultancy hands you a maturity model and an invoice. We score you against the same model, then stay to build the integrations, migrate the data, and roll out the process. We come from a GTM background, not a management-consulting one.
Get Started
A 30-minute call. We'll walk through where your revenue data is likely breaking and what the audit would cover for your stack.
Frequently Asked
The questions RevOps, Sales, and Finance leaders ask us on the first call, answered directly.
Revenue leakage is the pipeline, expansion, and renewal value your business earns but never collects, usually lost to broken handoffs, misrouted leads, stalled opportunities, and unbilled usage. A RevOps audit surfaces it by reconciling CRM, MAP, and finance data against your actual funnel, then quantifying each gap in dollars so you know what to fix first.
At $30M to $500M ARR, the durable pattern is one RevOps leader owning strategy and governance, with dedicated pods for systems (CRM/MAP admin and integrations), analytics (reporting and forecasting), and enablement (process and adoption). Ownership is explicit per system and per data field: no shared inboxes, no orphaned workflows.
The core objectives are pipeline reliability, forecast accuracy, and revenue efficiency. Track them with stage-conversion rates, sales cycle length by segment, pipeline coverage, forecast variance, CAC payback, and net revenue retention, measured from a single source of truth, not a spreadsheet per team.
It is a repeatable loop: measure the funnel end to end, diagnose where value leaks, prioritize fixes by revenue impact, implement, then re-measure. A mature RevOps function runs this quarterly against a fixed baseline. That is the mechanism by which compounding gains happen instead of one-off wins.
Revenue architecture is the blueprint of how your systems, data, and process combine to produce revenue: the schemas, workflows, and definitions everything else depends on. A RevOps audit is how you inspect that architecture: what exists, what is fragile, and what needs to be rebuilt before you scale on top of it.