The world of software-as-a-service (SaaS) companies is growing at a fascinating rate. The number of initial public offerings (IPOs) by SaaS companies has nearly tripled over the past decade. Moreover, the market is forecastеd to grow to $120 billion in 2021, and expected to reach a compound annual growth of 21 percent.
What makes SaaS ventures so successful is their unique business model, thanks to which they are able to collect revenue on a regular basis. However, growing and scaling a company with a predictable revenue steam, is not an easy task. If you wish to thrive in the world of SaaS, you have to make thoughtful, data driven decisions, and keep a very close eye on the right performance metrics.
Growth metrics are the core indicators of your company’s health – they are the body, heart and soul of your business. They allow you to analyze the momentum of your organization as well as its ability to grow and continue growing.
Understanding your growth metrics would make you more aware of the rate at which your business is developing. They can help you stay on top of your game by identifying key areas for improvement, and by ensuring you successfully communicate your firm’s value to clients and investors.
In this article, we will go over 11 of the key SaaS growth metrics to keep track of so your business can achieve sustained growth.
1. Monthly Recurring Revenue (MRR)
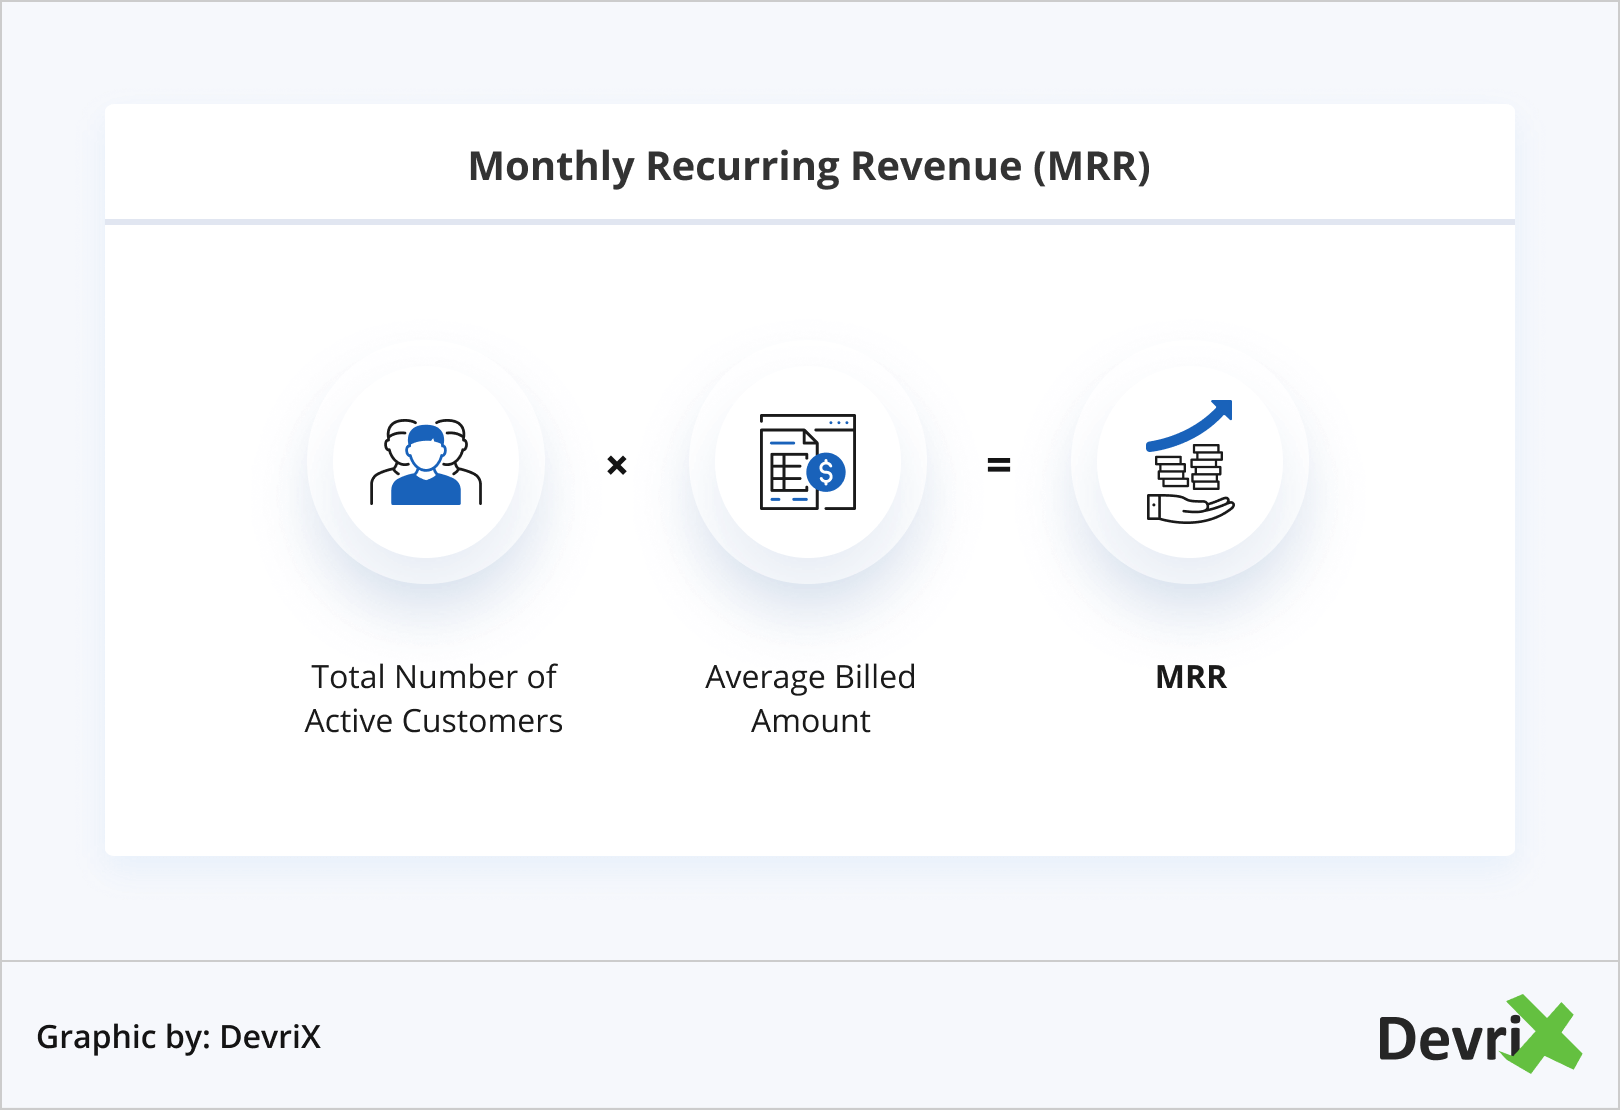
Because SaaS companies are usually subscription-based, the Monthly Recurring Revenue (MRR) is the lifeblood of their business model. It’s an important metric to keep tabs on as it helps you forecast your income and ensure that your daily operations are running smoothly. It’s a single and consistent number to track alongside your subscriptions, sales, pricing plans and billing cycles.
MRR gives a good overview on the number of customers you’re gaining and losing. What is more, it presents a relatively easy way to summarize the earnings you receive from paying customers each month.
To find out your average MRR, you need to add up the recurring revenue generated by the number of that month’s customers.
For example, let’s say you have a customer base of 5 people. Two of them pay $100/month, another two pay $150/month, and one pays $1200/year. The MRR, thus, will be (2 x $100) + (2 x $150) + ($1200 / 12) = $600.
While this seems simple enough, it gives only an average monthly view. So, depending on the complexity of your business, there are multiple MRRs for your SaaS company to track.
Here are the different types of MRR you can measure:
- New MRR – Additional revenue thanks to new monthly customers.
- Churn MRR – Lost revenue due to customers who cancelled their subscription or downgraded it.
- Add-on MRR – Sometimes referred to as Expansion MRR, is the additional revenue generated when existing customers buy complimentary product features, upgrade their account, add a new user, etc.
- Net New MRR – The total monthly recurring revenue at the end of each given month, including add-on and churn MRR.
- Committed Monthly Recurring Revenue (CMRR) – Predicted revenue that combines MRR, new bookings, churn and updates/downgrades,but does not take into account one-time-only fees.
- Contraction MRR – The total reduction in MRR due to subscription cancellations and downgrades compared to the month before.
- Quick SaaS Ratio – This metric is an indicator of the health of your growth. It’s designed to compare revenue growth over a particular time period with revenue reductions over the same timeframe. It’s formula is:
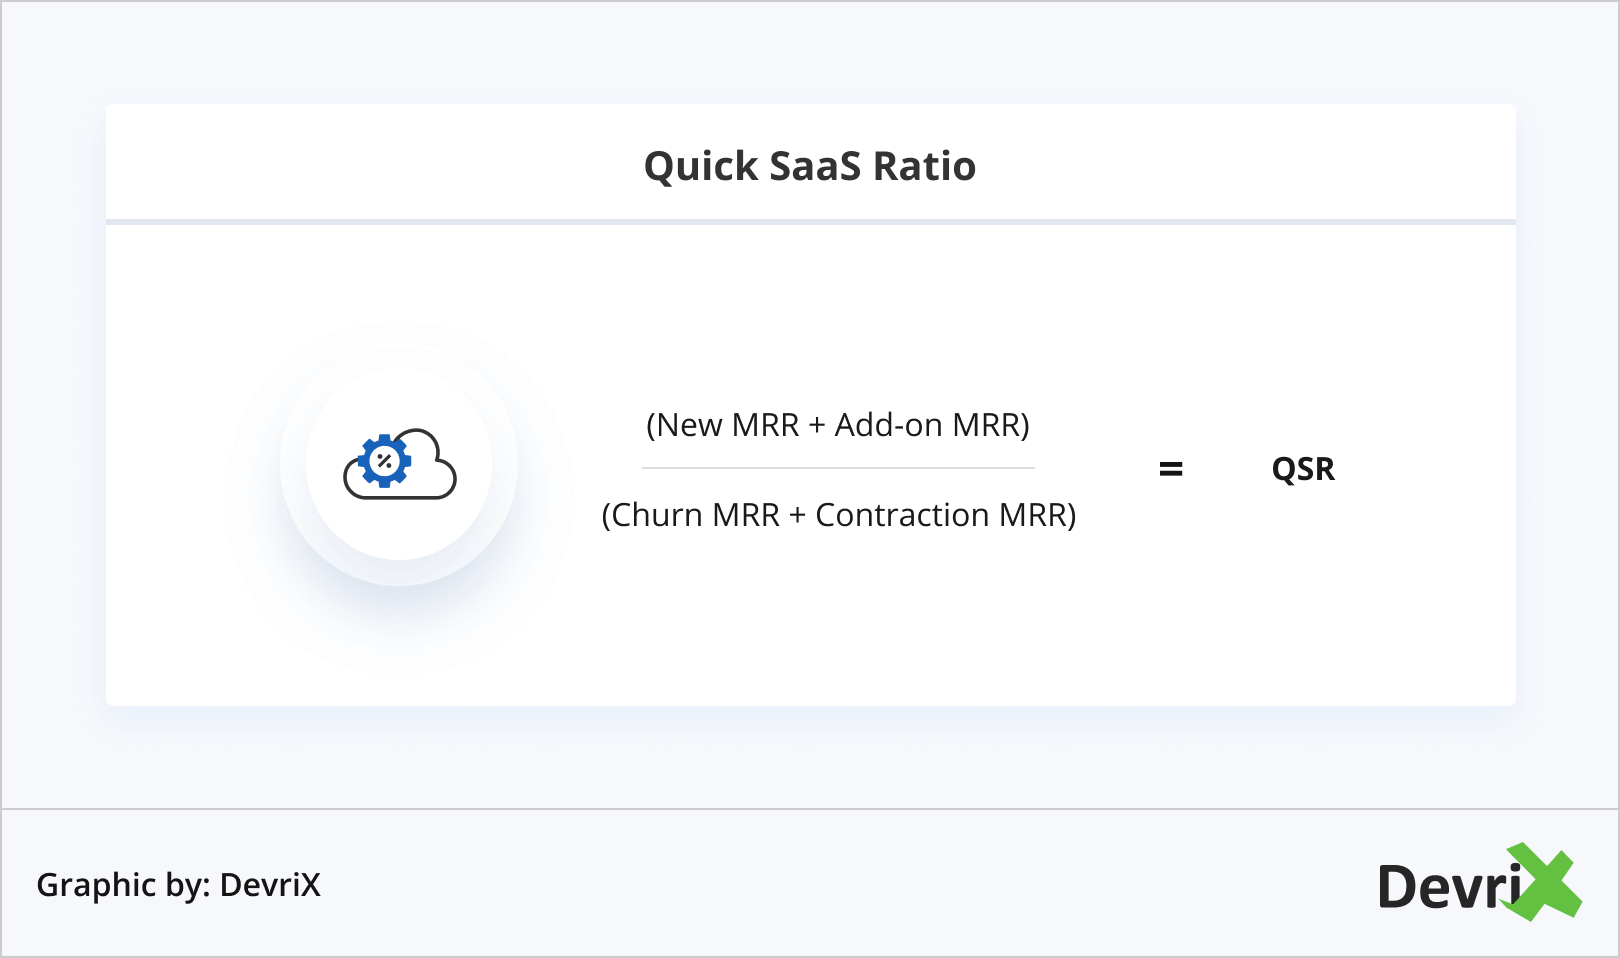
Every business can calculate the net MRR by measuring the new MRR and the churn MRR. Additionally, if you have a pricing or packaging strategy that allows you to generate additional revenue, you should calculate add-on MRR and include it in the net MRR.
If your churn MRR is higher than your new MRR, it means that you’re losing as many customers as you are acquiring, which can end up with you going out of business quickly.
If your add-on MRR is higher than your churn MRR, it means that you have found a way to retain your customers successfully – i.e. enough of your current subscribers are upgrading to offset subscription cancellations. In this case, the average new customers acquired will grow your revenue.
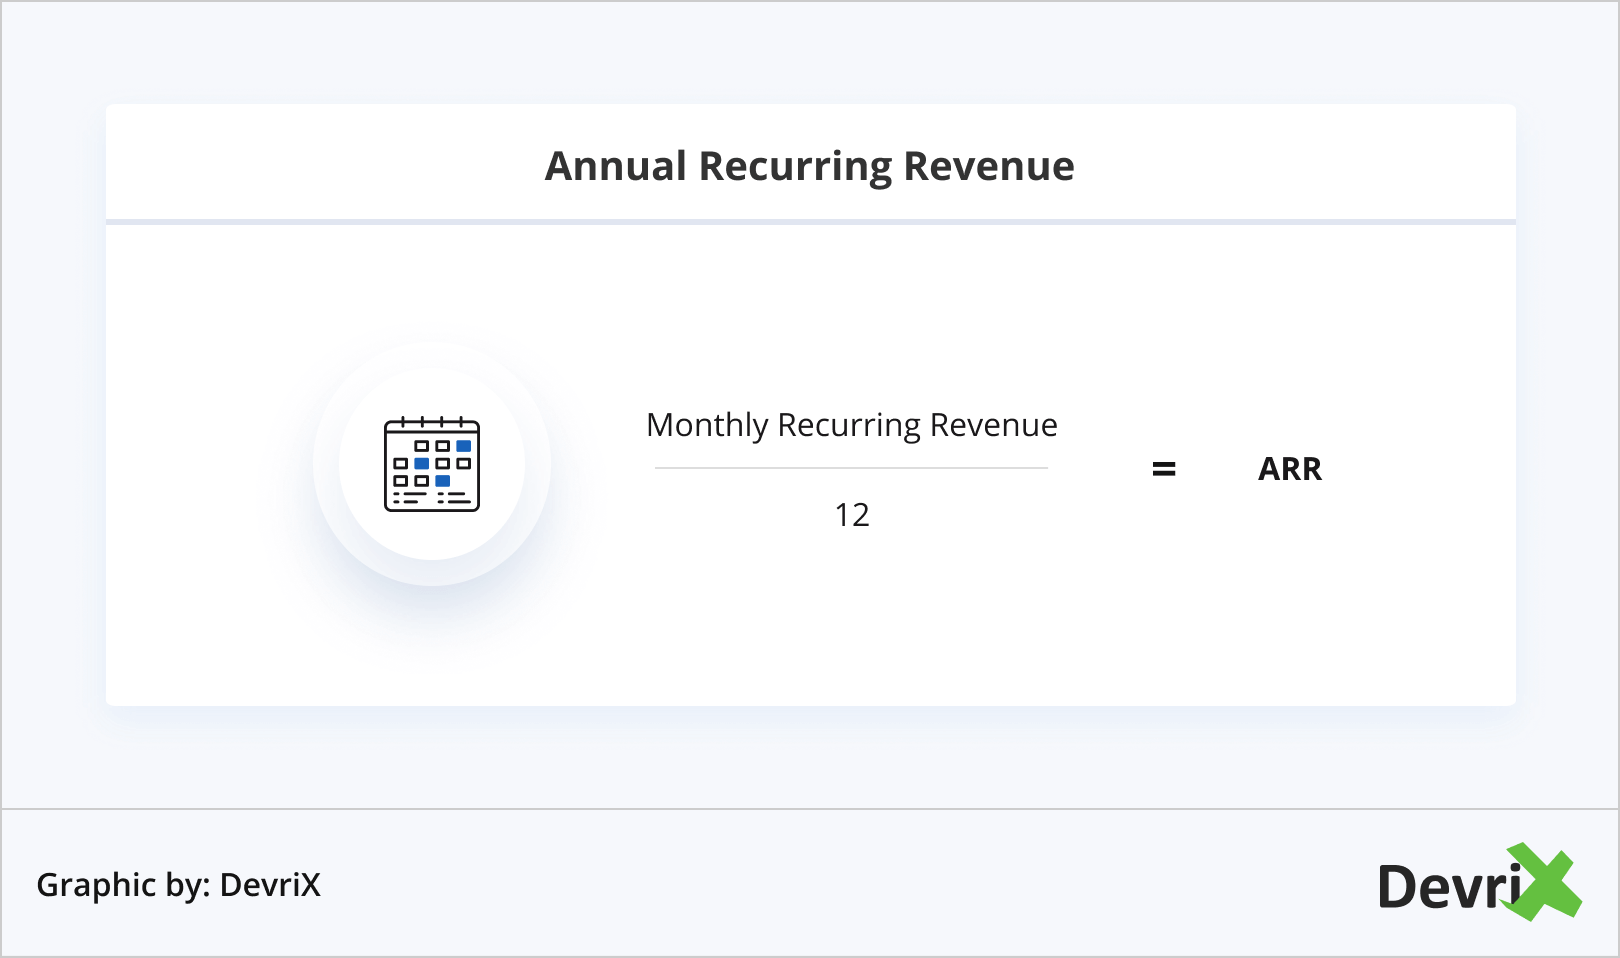
2. Annual Recurring Revenue (ARR)
The Annual Recurring Revenue (ARR), also referred to as Annualized Run Rate, is the recurring revenue generated over the period of one year. It’s thus calculated by multiplying the MRR by 12.
Because most SaaS companies generate a large part of their revenue from their monthly subscriptions, using MRR as a revenue generation indicator is usually more appropriate.
However, there are SaaS businesses that deal with yearly contracts as well. So, if the yearly subscriptions are the main revenue stream of your business, ARR may be a better metric to use.
- Read also: How to Improve at SaaS Sales in Eight Steps
3. Average Revenue Per Account (ARPA)
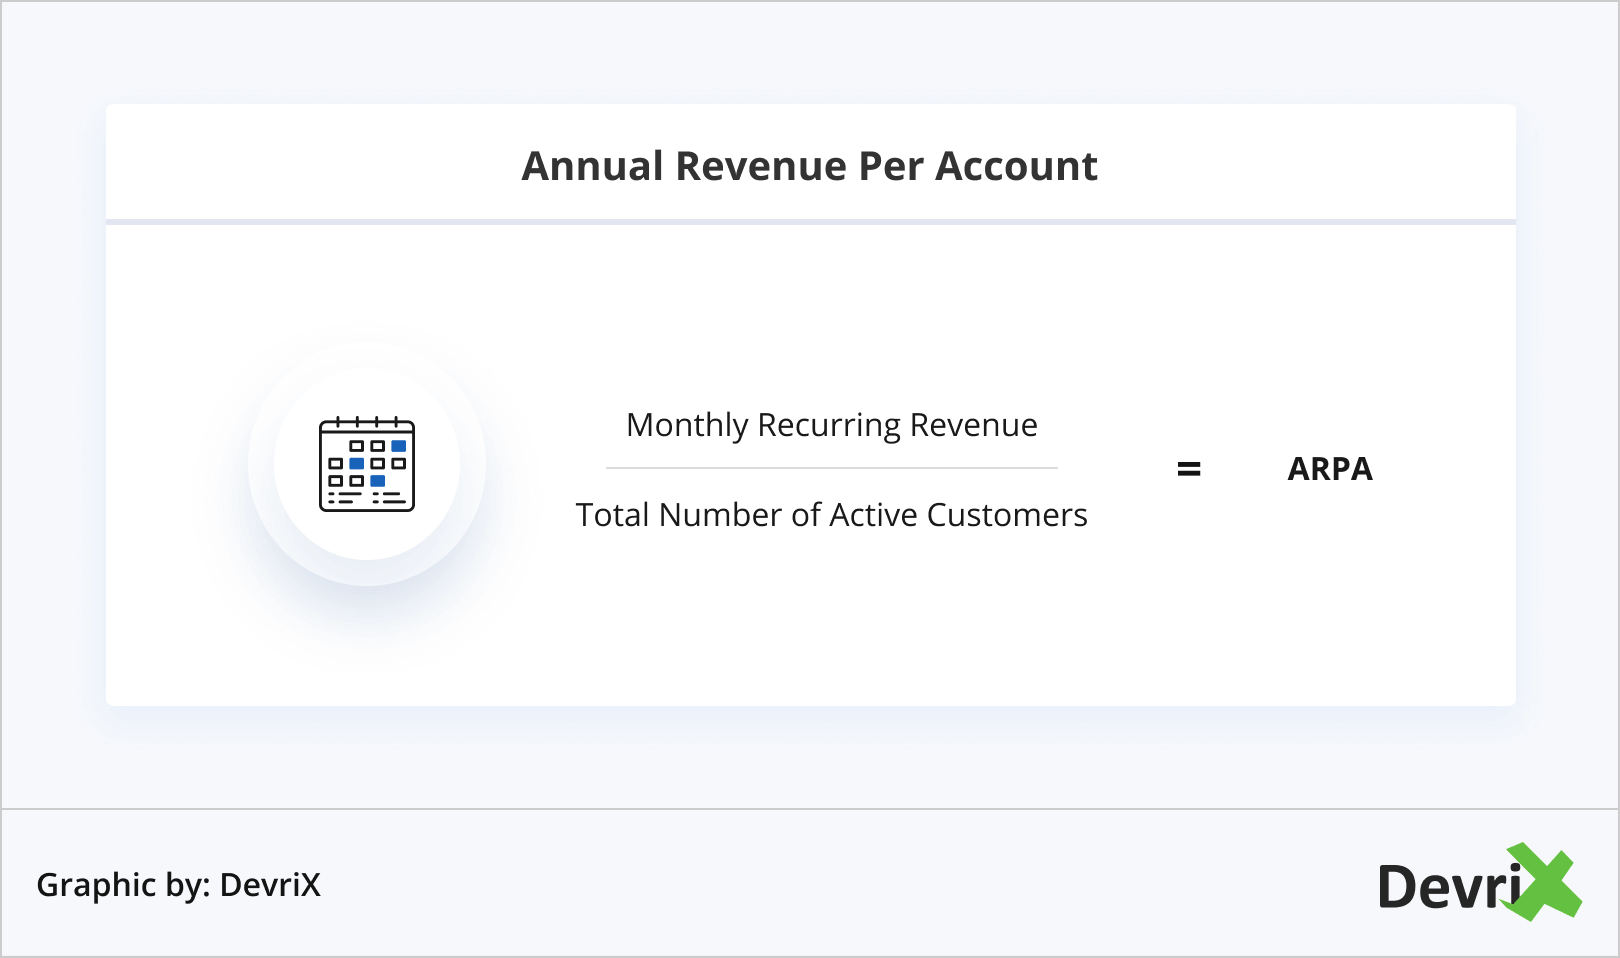
The Average Revenue Per Account (APRA), also known as Average Revenue Per User/Unit (APRU), measures the monthly, quarterly or annually generated revenue per account/user/unit. The time period over which it’s calculated can vary depending on your plans and billing options.
A simple formula to calculate APRA is to measure the total MRR at the ended of a given month, then divide it by the number of active customers at that time:
To have a better idea of how your APRA is evolving, measure it separately for new and existing customers, especially if the new subscribers behave differently compared to the existing ones.
To effectively track ARPA, it’s important that you can rely on your accounting or billing system. Regardless of the system you’re using, you need to pull all relevant data, so your calculations are as accurate as possible. If you’re using multiple payment methods, then it’s good to have a centralized accounting system, so all your numbers are available to you in one place.
4. Customer Churn Rate
The churn, or often referred to as attrition, rate reflects how many customers leave or unsubscribe from your service/product over a given period of time. It often indicates customer dissatisfaction, better marketing initiatives from competitors, better or cheaper offers from the competition, shifts in strategy and business failure.
A certain level of customer churn is always expected. However, the more it grows the more trouble for your company it will bring. An increased attrition rate means that you’ll need to invest more capital to maintain your revenue. Otherwise, it can quickly sink your company.
A good annual churn rate for a typical SaaS company is approximately 5% – 7%. This makes a good monthly churn about 0.42% – 0.58%. If you sell to smaller businesses, you should expect a higher churn rate. Alternatively, if you sell to large enterprises your churn rate will likely be lower.
Acquiring new customers is costly, so it’s important that you concentrate on retaining the existing ones. Nonetheless, keeping a close eye on your customer attrition rate is necessary in all cases.
To identify the reasons for your churn, investigate why your customers left by contacting them. Aim to find a positive balance where client usage surpasses the attrition levels. The best way to retain your users is to ensure you provide them with good value.
Implement strategies that prevent customers from unsubscribing, for instance, try upselling better deals. If you focus your efforts on increasing your monthly revenue by a greater amount than the revenue you lose you should be able to achieve a negative churn and a positive net revenue.
To create an effective negative churn strategy, factor in all the elements that affect it. Then use your accounting data and CRM system to calculate it accurately.
5. Customer Acquisition Cost (CAC)
Finding a cost-effective way to acquire new customers is a key for scaling your SaaS venture. This is how you can discover profitable avenues and ensure your business thrives.
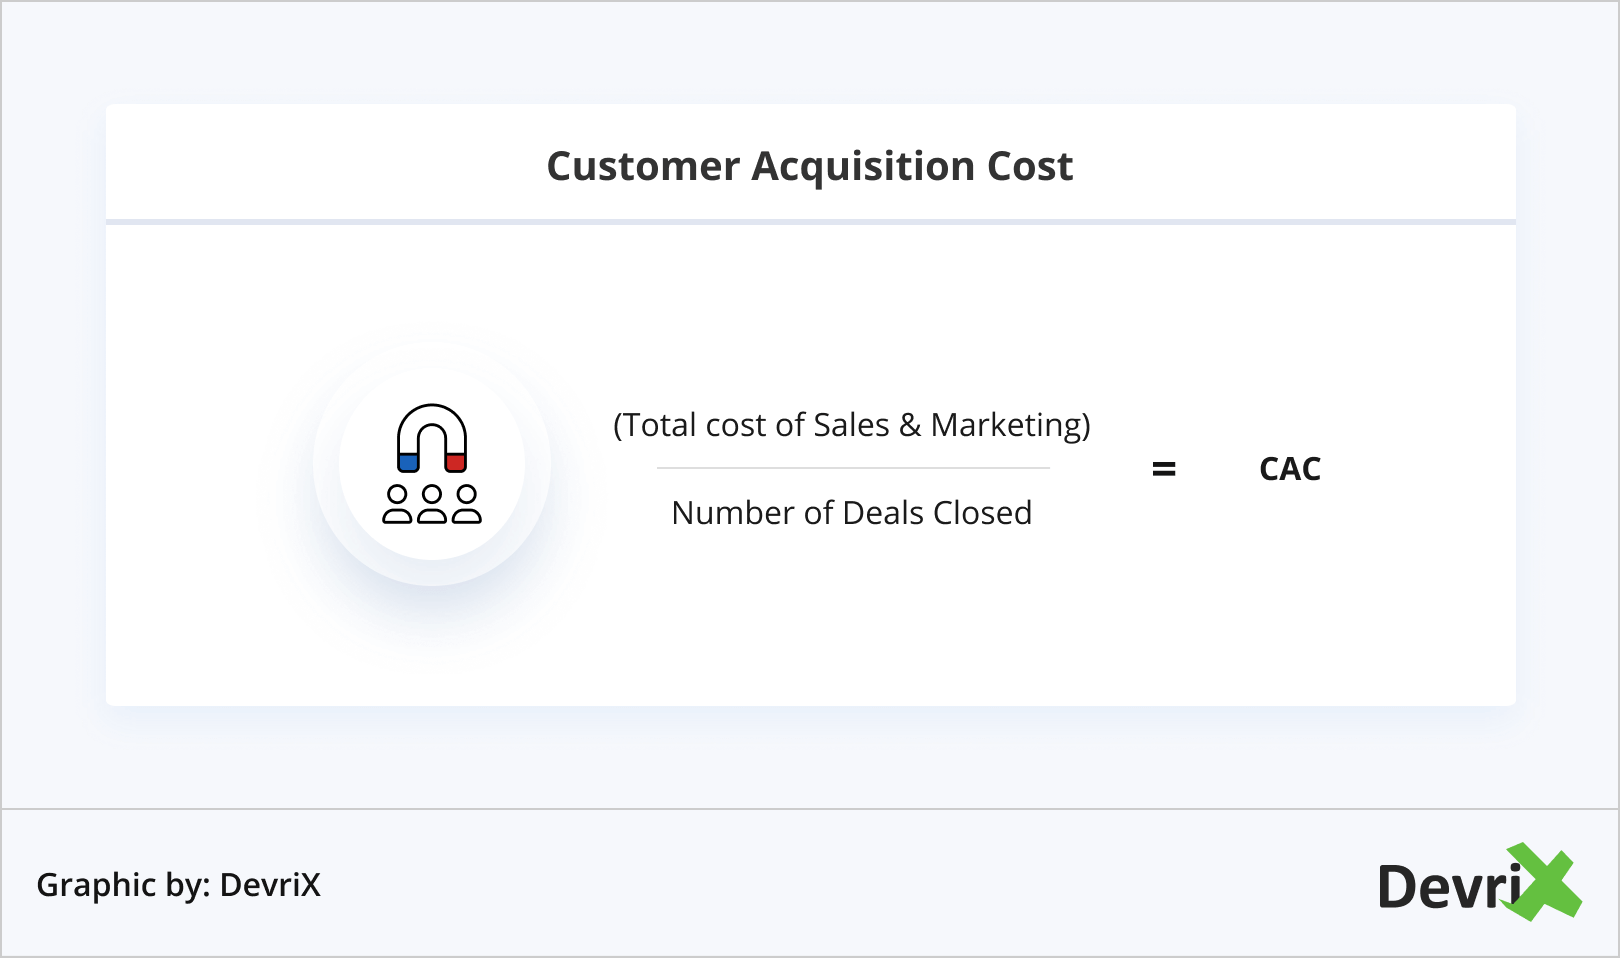
To find the most effective Customer Acquisition Cost (CAC) you need to calculate the total costs of your outreach – sales and marketing costs, and divide these by the same number of closed sales.
If you have an inbound marketing team, make sure you include their salaries in the calculations. But if your product/service sells itself, you can calculate your costs without the headcount expenses. To measure CAC accurately, combine all your costs, then track and add any new users per time period.
The CAC can vary a lot depending on the complexity of your selling model. If you want to reduce your activation rate, you can use A/B testing to develop better conversion rates. Alternatively, you can try to minimize the efforts of your sales team or make your product/service easier to use.
If your CAC is low, it could mean that your onboarding process is difficult or confusing to follow, thus turning your prospects away. In such a case, it’s important that you investigate why this happens so you can improve it in a timely manner.
It’s very important that you balance your CAC with your customer lifetime value (CLV). The activation rate shouldn’t exceed the CLV. According to David Skok, CAC should be around 3 times smaller than CLV. If you need to recover your CAC you will only have a year, otherwise your company will need much more capital to be able to grow.
6. Customer Lifetime Value (CLV)
The Customer Lifetime Value (CLV/LTV) estimates the value of every given customer. It helps you make key decisions regarding marketing, sales, customer support, product development, and as such it’s an essential metric to track.
There are a few steps you need to take to calculate your CLV. First, you need to measure customer lifetime with this formula:
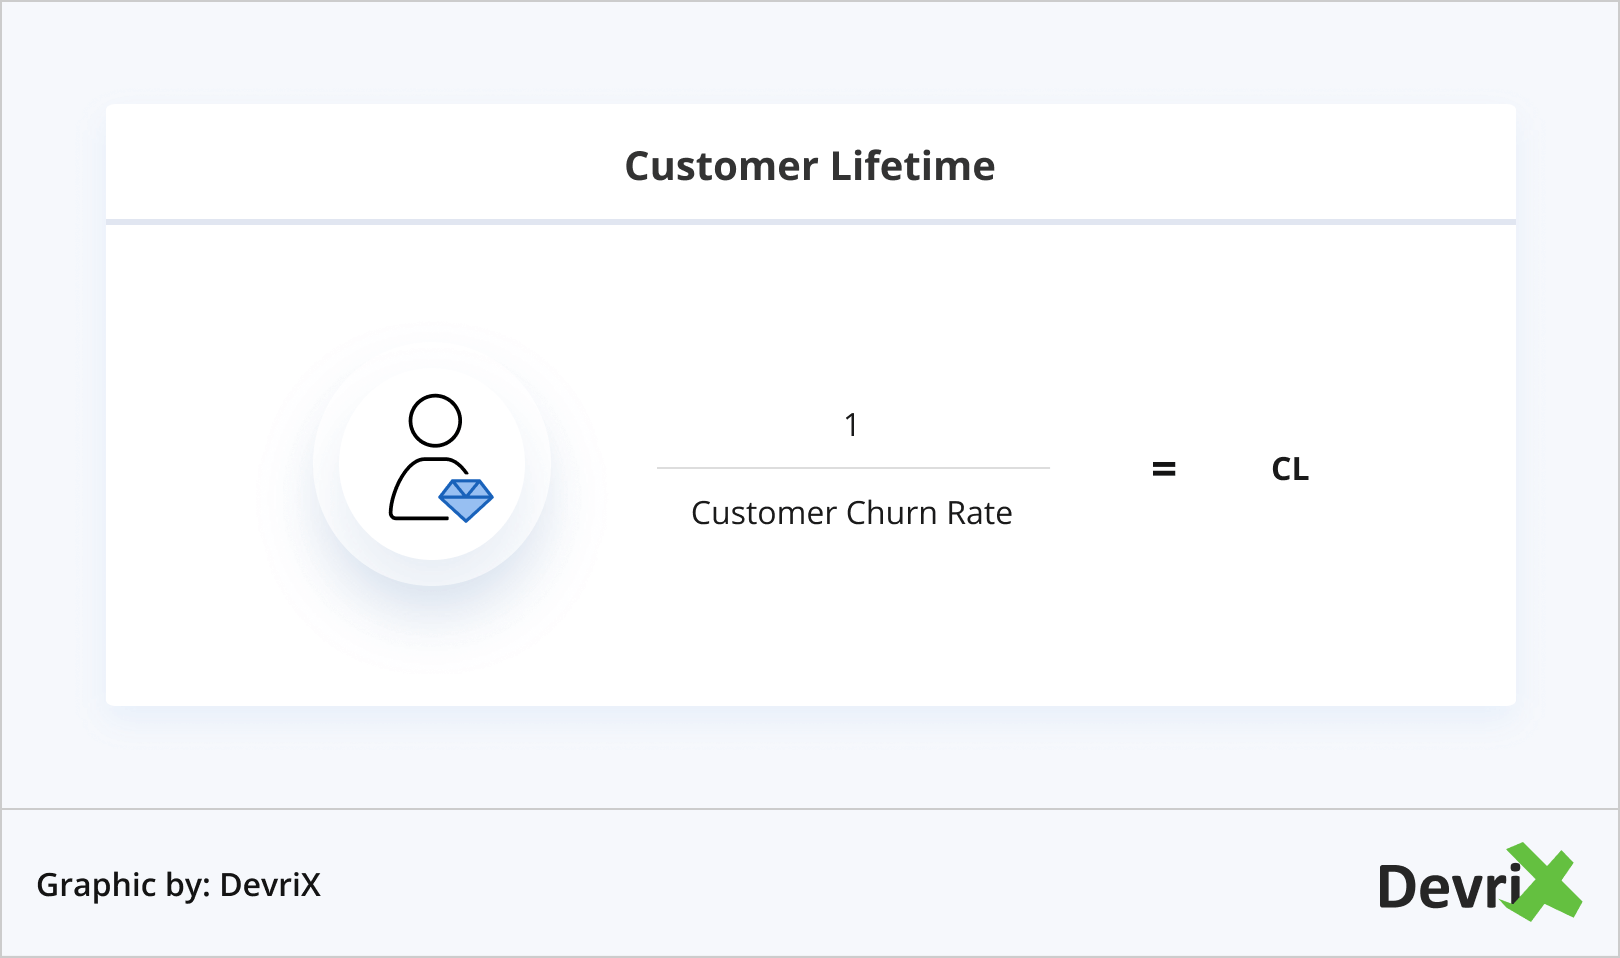
Ensure all values are in the same format. If you’re using monthly churn rates then you’ll calculate the customer lifetime in months.
Second, you use the result of the customer lifetime to find their lifetime value in the following formula:
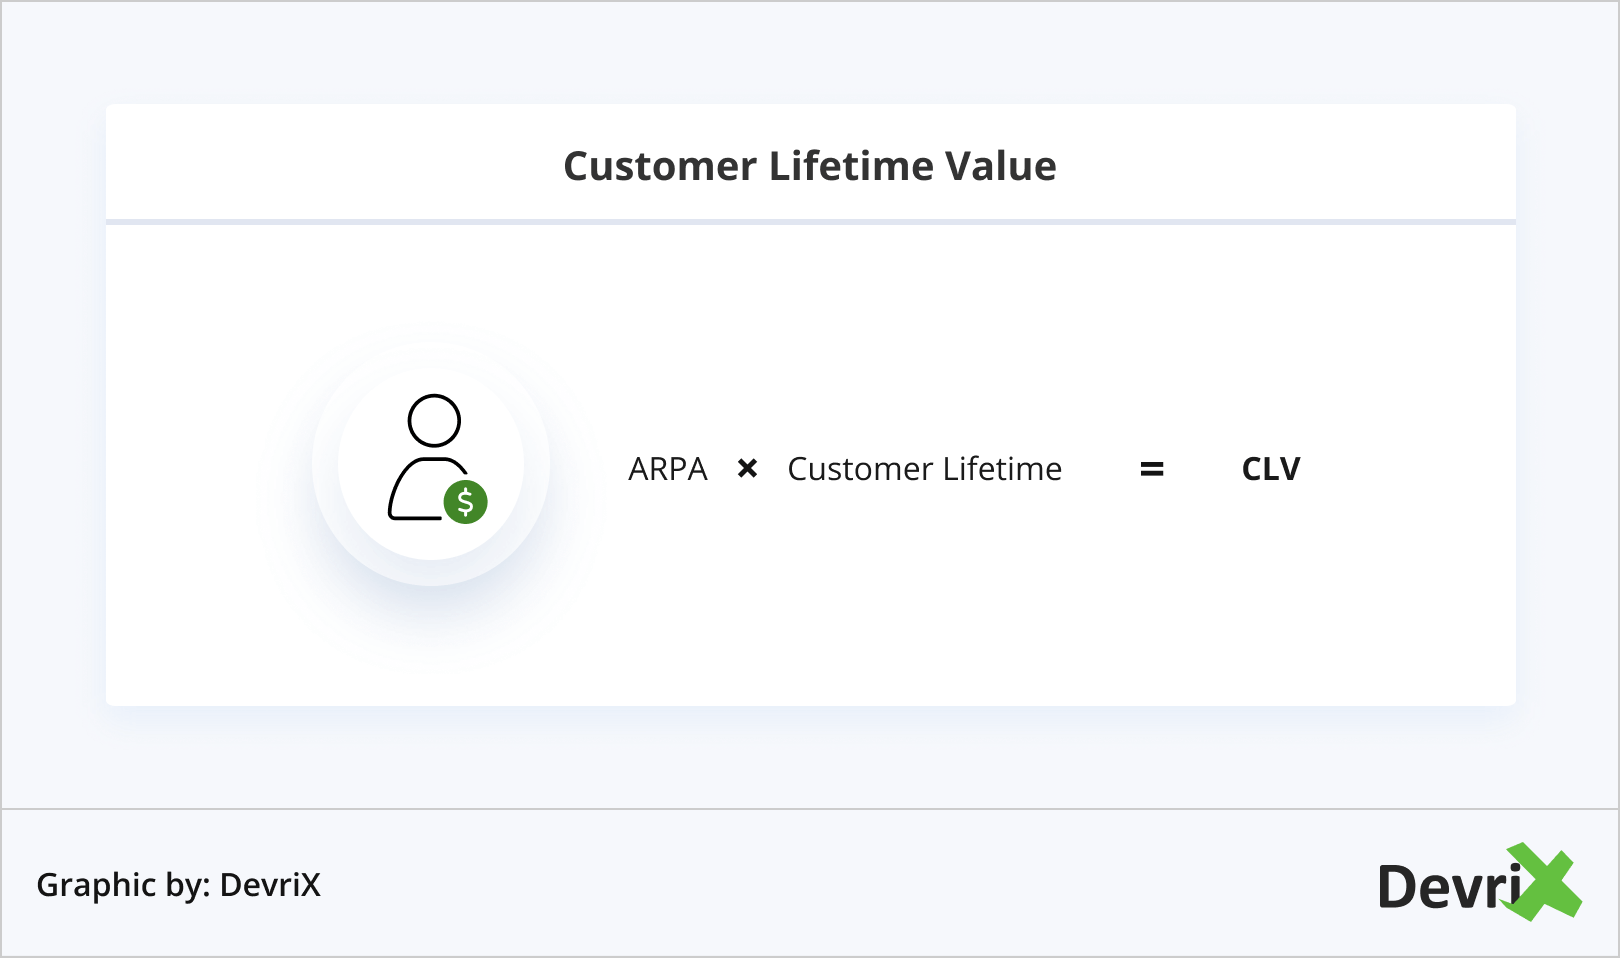
The CLV is an important metric in discovering if your company’s business model is viable. As you can see, churn rates significantly affect the CLV. So, reducing the churn rate in half will increase your CVL twice.
7. Customer Activation Rate
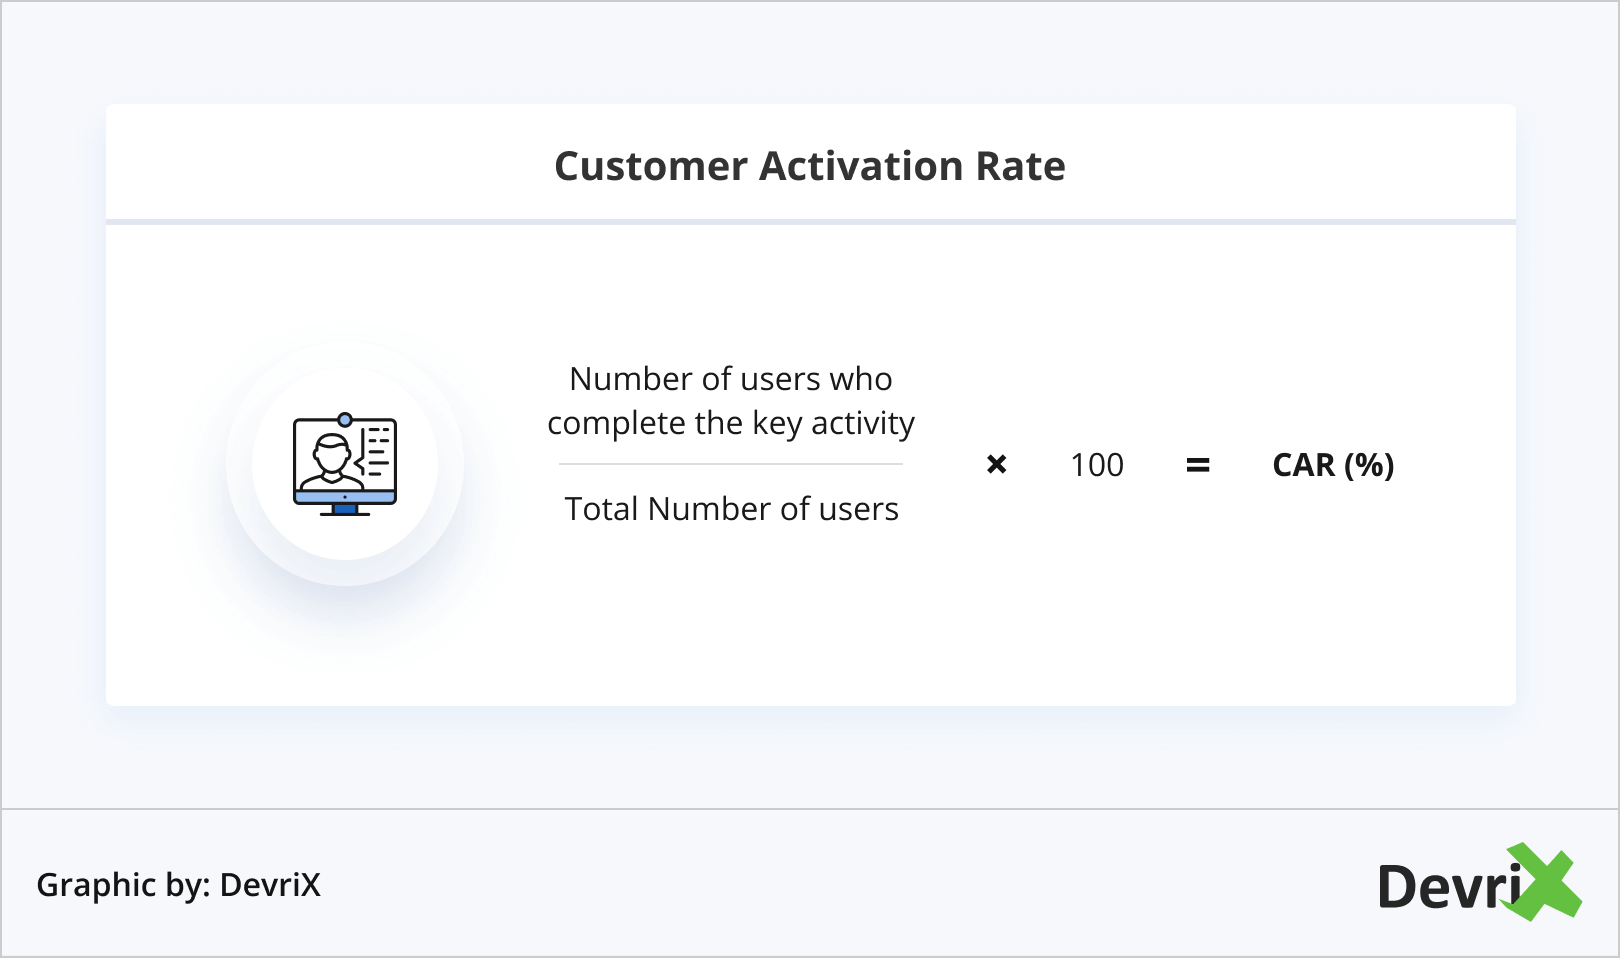
The customer activation rate, also known as user activation rate, is a metric that helps SaaS companies determine how quickly and effectively their new customers are achieving perceived value. It measures the percentage of users who have successfully completed a key activity in your onboarding process.
This key activity, or milestone, can vary depending on your offering and business goals. It can be any event, within a set period of time, that adds value to users and increases their odds of coming back.
When choosing your milestone, think of actions that would convert prospects into paying customers upon completion. For example, for a music-streaming app a key milestone can be when a user creates their first playlist. While for a social media platform it can be when users make their first post or add friends.
After you know which key activities to track, you can calculate the customer activation rate using the following formula:
You can use analytics tools like Google Analytics to collect and monitor the data you need. Then you can compare your activation rate to your industry’s benchmarks or to your own previous activation milestones.
8. Customer Retention Rate
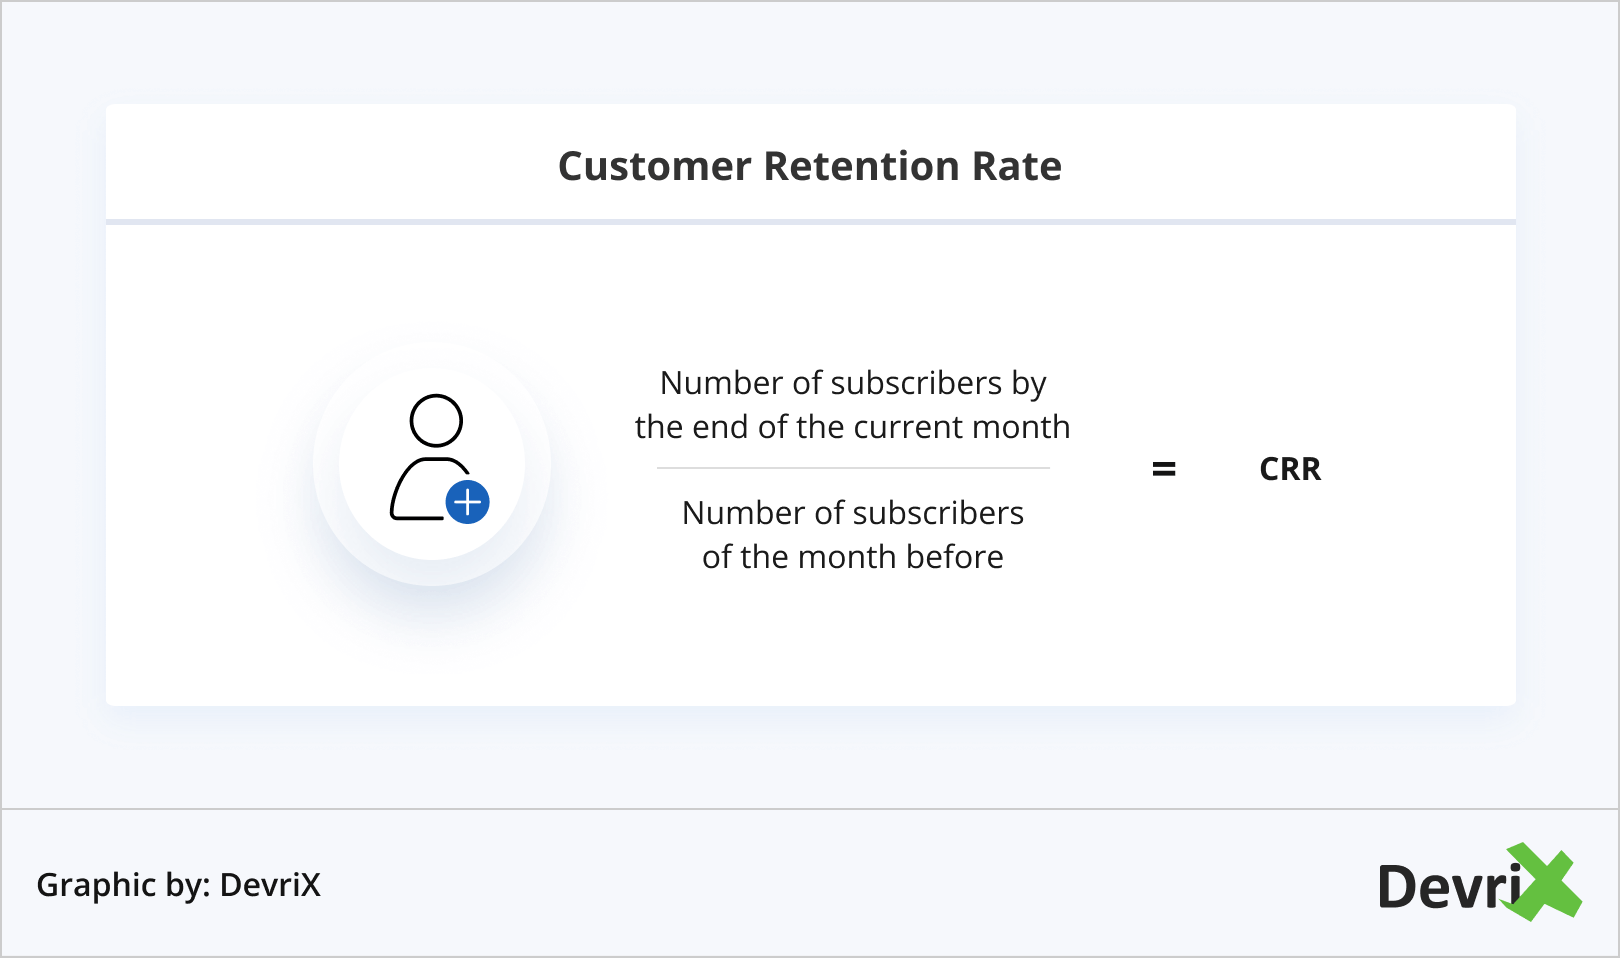
The opposite of churn is the customer retention rate. It is a metric that indicates the proportion of users who have continued to use your product/service for a while.
It’s common sense that in order for your SaaS company to grow and thrive, you should build a product/service that people love and continue to use.
With a good retention rate you won’t have to spend a lot of time and effort attracting new customers. Instead you can focus on keeping the existing ones for longer.
To calculate your monthly customer retention rate you need to:
- Know the number of repeated orders for current clients.
- Compare this number with numbers from the previous two months.
- Divide current repeat orders by orders from two months ago.
Keep in mind, you should not add any new customers acquired during this period.
To put it into an example, if you had 2000 subscribers last month and by the end of the current month there are 1400 left, your churn rate would be 1400/2000, which translates to 70 percent.
9. Lead Velocity Rate (LVR)
The Lead Velocity Rate (LVR) corresponds to the percentage of qualified leads month over month. It measures how many potential customers you’re currently trying to convert into buying customers.
The formula to calculating LVR is:
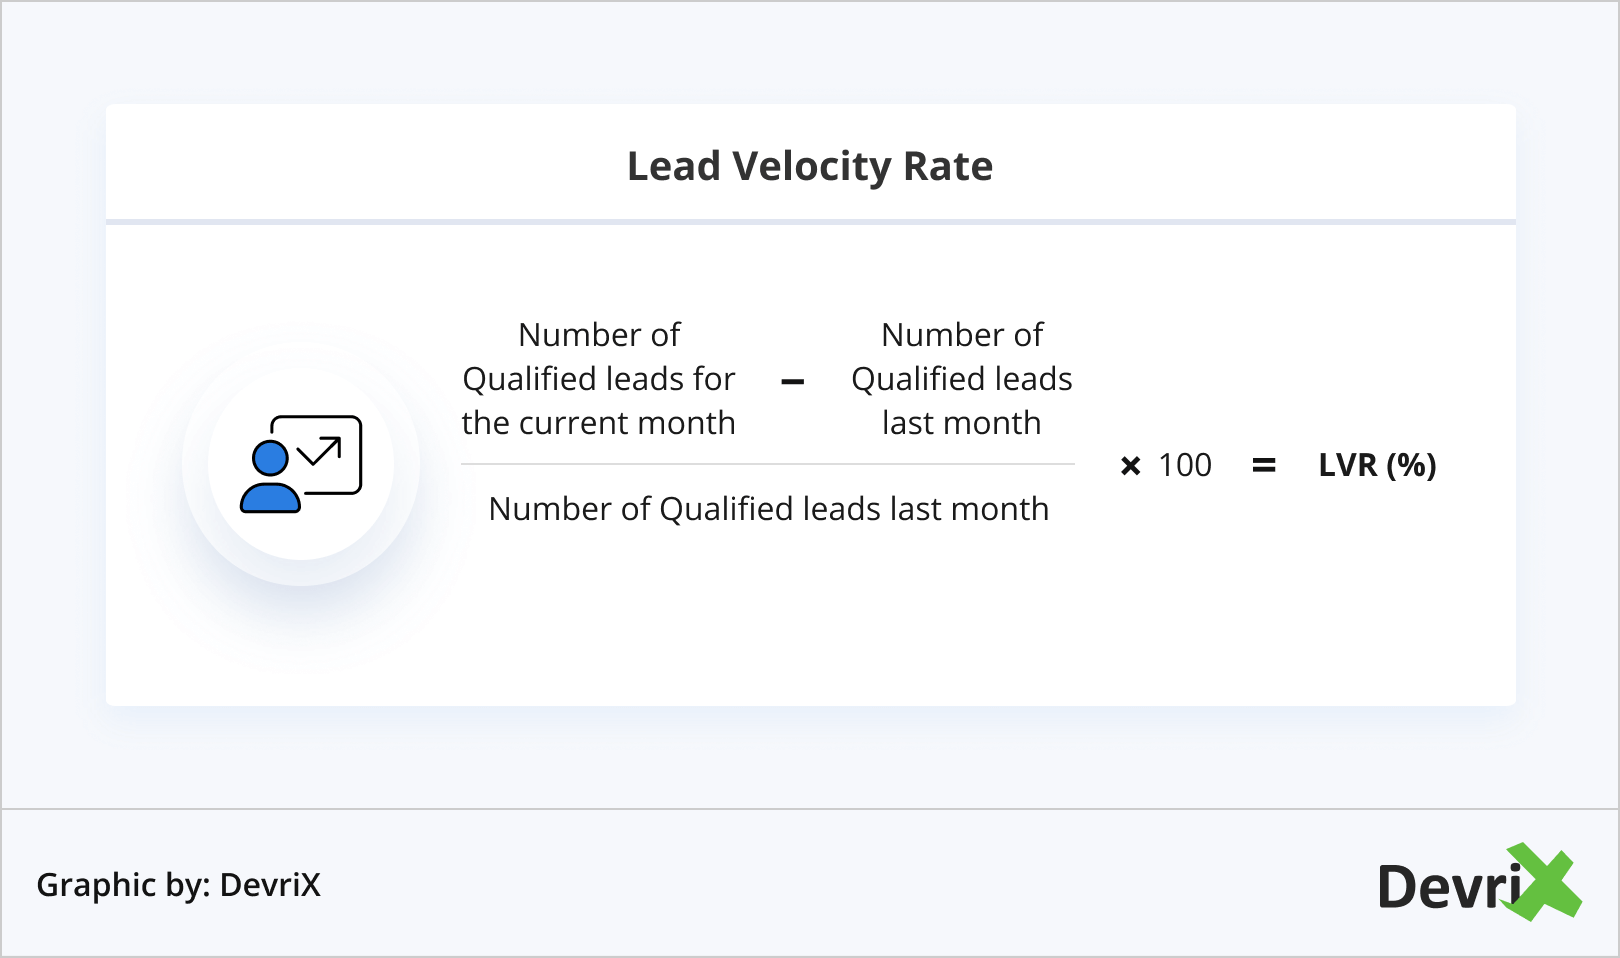
The LVR is calculated in real-time and as such is able to more clearly predict your revenue growth. While your actual revenue may fluctuate, increasing the number of qualified leads per month steadily can help your SaaS company grow. It can help you see if you’re trailing, so you can take immediate action to ensure you can generate more qualified leads before the end of the month.
However, LVR is not actual revenue. If there are setbacks in the sales process, which prevents leads to actually get closed, this metric tends to be unreliable. To avoid this, track it alongside the sales and marketing qualified leads.
10. Active Users
The number of active users shows how many people are actively using your product/service. It indicates how healthy your customer base is.
The number of active users can give you valuable insights into how your business is performing over a certain period of time. For example, they can indicate how your revenue and gross margins have changed over time, as well as how well your service fits your market.
It’s important that you identify the dimensions that make a user an active user for your SaaS business. You can base the criteria on some of the features subscribers are using, the frequency they are using them with, or a combination of the two. So long as your client continues to derive value from your product/service, they’re an active user.
It’s best to divide active users into separate categories, such as ‘active mobile users’ or ‘active web users.’ Based on your preference, you can even subdivide those categories according to daily, weekly and monthly active users – DAU, WAU, and MAU respectively.
The average number of active users should increase perpetually. For consistency purposes it may be best to calculate it on a monthly basis.
11. Net Promoter Score (NPS)
The net promoter score (NPS) is one of the most commonly used SaaS metrics. It measures customer satisfaction using customer surveys to get a better idea of customer loyalty.
While NPS helps calculate how happy your customers are with your service, it shouldn’t be used in isolation. Other factors like client rating and feedback are also necessary to evaluate the efficiency of your support team. Additionally, it would be smart to measure your NPS after product/service updates so you can see which of them triggered a positive or negative reaction.
The net promoter score is a great indicator of the likelihood that your customers recommend your product. Moreover, it can even reflect customer retention in a given month.
This score works on a scale from 0 to 10 – 0 meaning that the customer will never recommend your service, and 10 meaning that they definitely will.
The respondents are usually divided into three categories:
- Detractors – Users who give a score between 0 and 6.
- Passives – Users who give a score of 7or 8.
- Promoters – Users who give a score 9 or 10.
To calculate your NPS, however, is not as simple as just adding all the scores together and deriving a net average. You need to calculate the mean value of the results, which you can do with the help of a software or by using a regression analysis.
Conclusion
Measuring the right success metrics is crucial to understanding the growth rate of your SaaS venture. Without knowing what these are you may be going in the right direction, but without any idea how fast you’re moving or when you’ll get there.
Keeping track of the key SaaS performance metrics for your company allows you to periodically check them and at your own convenience. This way you are aware of what changes, when it changes and why.
We hope that with our list you’re ready to take your venture to the next level. Let us know how it worked out for you and don’t hesitate to reach out to us if you need any assistance.
Team DevriX
This article is crafted by DevriX's seasoned marketing team, boasting over four decades of collective expertise in crafting sophisticated marketing funnels, devising comprehensive content frameworks and pillars, implementing engaging email campaigns, and creating impactful social media content designed for scalability.
Our marketing experts specialize in the complete spectrum of inbound marketing strategies. As an accredited HubSpot Agency Partner and a Semrush Partner, we engage in meticulous research, blending our extensive experience with the unique insights of our highly skilled team.
We set benchmarks in content creation by incorporating cutting-edge marketing trends, leveraging in-depth industry research, and utilizing state-of-the-art AI tools for data segmentation and captivating content hooks. Our proficiency extends across a diverse range of sectors, including working with SMEs, Fortune 1000 companies, global B2B brands, major publishing entities, WooCommerce platforms, business directories, and affiliate networks.