There are numerous and very important elements that you need to measure for a winning lead management campaign.
Moreover, there are a few indicators that can provide a comprehensive and high-level overview of the campaign performance.
What are these Key Performance Indicators (KPIs) and how can you leverage them to execute lead management successfully?
Readers Also Enjoy: How a CRM Software Can Improve Lead Generation – DevriX
What Is Lead Management?
Lead management is the process of identification, education, engagement, and qualifying of potential buyers before passing them to the sales department. Managing leads is a comprehensive B2B strategy that can generate profit for your business.
As an activity, it starts somewhere between branding and advertising, and direct one-to-one sales efforts. Right from the beginning, it is all about focusing on building client interest through educational and nurturing efforts.
Read: Top 10 Lead Conversion Strategies to Boost Your Business Success
Importance of Tracking KPIs for Lead Management
KPIs can be crucial to a business’s success or failure. Monitoring and reacting to the insight provided by these metrics will give you the opportunity to run your company from a much better point of view.
As the metrics change their values, you can make the required adaptations to compensate for any diminished result and improve your lead nurturing performance.
Lead management as an ongoing sales activity has a lot of KPIs and metrics, but, some of them are vital for the entire lead generation strategy. Let’s outline them one by one and see how these metrics fit into your sales strategy.
![]()
- Lead acquisition cost.
- Lead conversion rate.
- Marketing and sales-qualified leads (MQLs & SQLs)
- Bounce rate.
- Average session duration.
- Exit rate.
1. Lead Acquisition Cost
Lead acquisition cost can be defined as the amount that you pay to obtain a single lead. To truly understand this metric, you’ll have to add together all the money that you spend on marketing, lead nurturing and sales efforts.
Readers Also Enjoy: Inbound Lead Generation for Startups: 8 Tips to Consider – DevriX
Readers Also Enjoy: Outbound Lead Generation for Startups: 8 Tips to Consider – DevriX
How to Calculate Your Lead Acquisition Cost?
The first step is to always set your business goals. More particularly, to determine how much revenue are you looking to generate for your venture for the upcoming months and year.
After that, examine your company history and look at your closing rate. Multiply the closing rate by your revenue goal:
Formula: Revenue Target x Closing Rate
When you learn how much money you spend on a new lead, you’ll be able to make calculated decisions on where to focus your sales and marketing efforts. Your ultimate goal should be to minimize the lead acquisition cost.
A low spending per lead that results in a big volume of quality leads is a positive indicator that your lead management campaign is going well. If the opposite is the case, rationalizing the campaign will be much harder.
2. Lead Conversion Rate
The lead conversion rate KPI gives you information about how good your sales team is in converting leads into actual deals.
If you want to improve the lead conversion, you have to implement the right optimization of your sales funnel. This means that you must have a better look at your sales and nurturing process and make the necessary improvements.
How to Calculate Lead Conversion Rate?
Before you attempt to calculate your lead conversion rate, you need to define your lead conversion goals. Lead conversion can mean different potential customer behaviors, from becoming an email subscriber, sharing content on social media to paying for a product or service.
Once you define your lead conversion goal, you’ll know what you need to measure. If you define the conversion as turning a lead into a customer, the formula should look like this:
Lead Conversion Rate = Number of New Customers/Number of Leads x 100
A good way to improve your lead conversion rate is to use clear calls-to-action in your website and marketing. Users should know exactly what to expect when they open your website. You need to measure, tweak and improve your website elements to enhance and inspire confidence in your brand.

Related: [Infographic] How to Design Your Website for Conversion Rate Optimization
3. Marketing and Sales-Qualified Leads (MQLs and SQLs)
Users are getting smarter with each passing day. Your sales process should keep up with their progress too. With complex sales funnels and various situations with potential clients, it’s important to define and segment your most qualified leads.
What is a Marketing-Qualified Lead (MQL)?
Hubspot defines MQL as “a lead judged more likely to become a customer compared to other leads based on lead intelligence, often informed by closed-loop analytics.”
There are many ways to assess if a lead is “more likely to become a customer”. The two main ways to do it are:
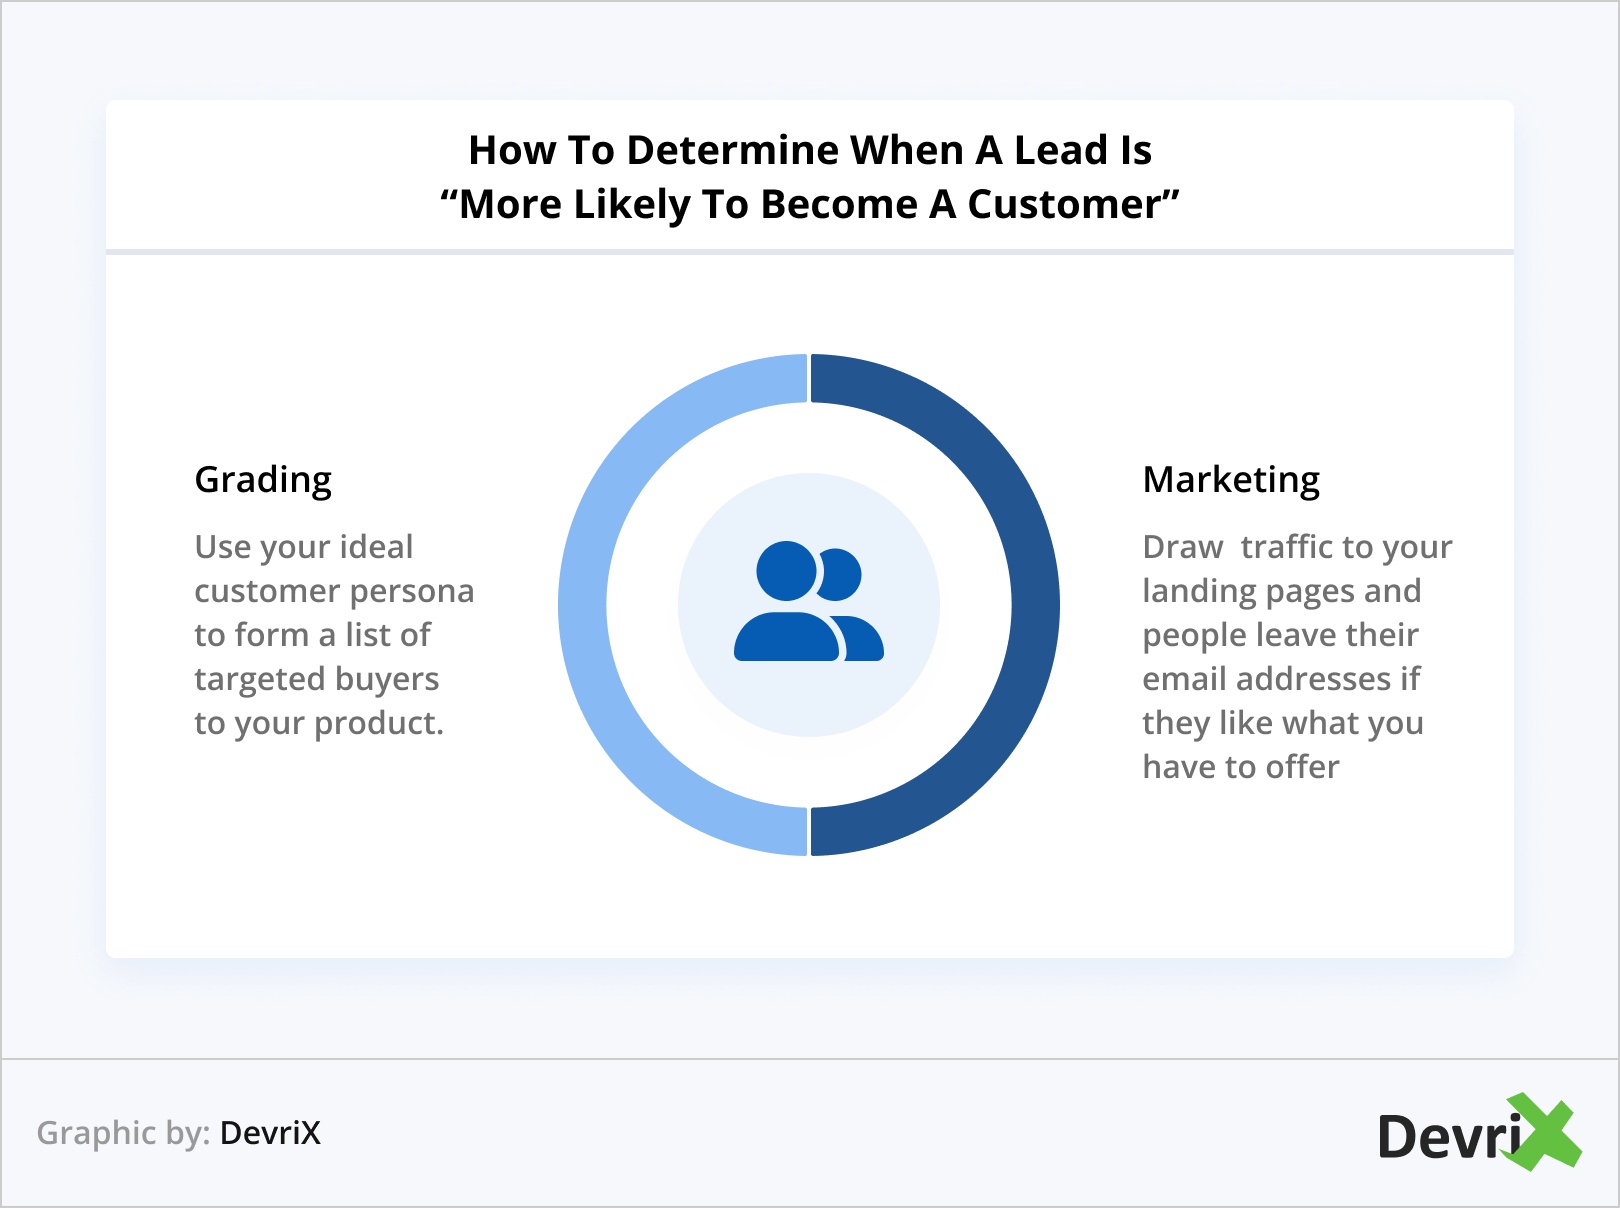
- Grading. You use your ideal customer persona to form a list of targeted buyers for your product. This is a hands-on approach, and it’s extremely useful if you’re in the B2B industry, and you need to pick the best of the best that will want to learn more about your product or service.
- Marketing. You draw traffic to your landing pages and people leave their email addresses if they like what you have to offer. This means that these people are interested in more. Leaving their contact credentials means that they want more interaction with your brand.
When grading MQLs, your goal should be to learn who is keen to buy from you. You need to segment those who are sales-ready leads and those that will waste your time.
What is a Sales-Qualified Lead (SQL)?
A sales-qualified lead (SQL) is defined as:
“A prospective customer that has been researched and vetted — first by an organization’s marketing department and then by its sales team – and is deemed ready for the next stage in the sales process. An SQL has displayed intent to buy a company’s products and has met an organization’s lead qualification criteria that determine whether a buyer is a right fit.”
This clarifies perfectly what needs to happen for someone to be qualified as an MQL before becoming an SQL. When a lead has been considered for the next stage, it means that someone finally asked to use your product or service after the nurturing process.
On any given sales pipeline, the connection between MQL and SQL is where most of the leads are qualified if they’re ready to become a customer or not. The marketing team can insert a qualified lead in the CRM system. An even better solution is to hand the phone or email contact to the sales department for them to engage with the lead.
Taking the time to qualify leads and to push your marketing and sales teams to collaborate will improve your lead management process and the close rate.
4. Bounce Rate
Bounce rate is the percentage of visitors who come to your website and leave without viewing any other pages on your website.
For example, if you look at your analytics and find out that your bounce rate is 80%, it means that 80% of online visitors leave your website after viewing only one page. That means that your website is not capable of keeping visitors interested in the site.
Either the users came, saw what they want and nothing more, or they didn’t like the content at all.
To find the bounce rate percentage in Google Analytics, go to Audience > Overview
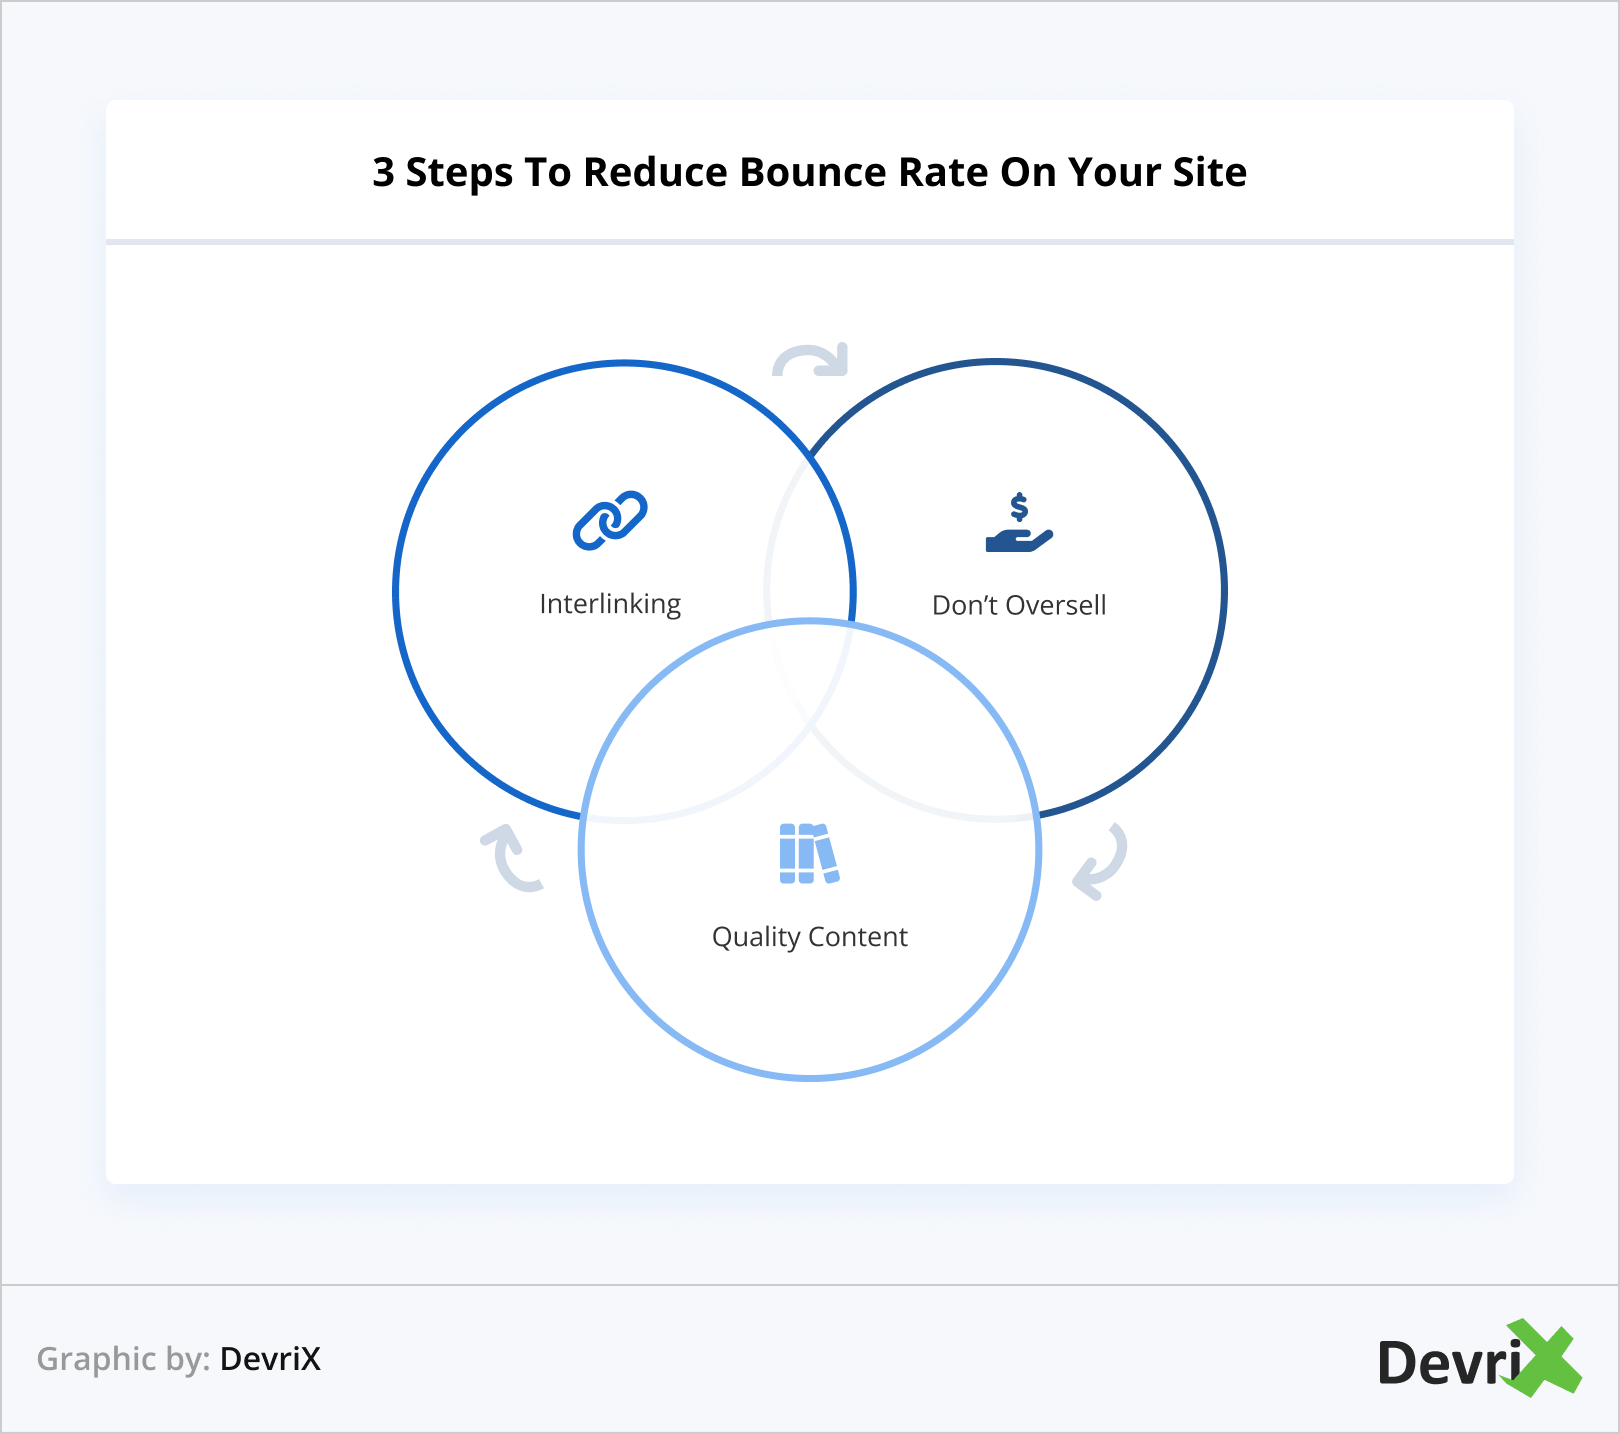
If you see a big bounce rate for your page, here are a few ways that can help you improve:
- Interlinking. You need to add more links from your website within your content. See if a particular page can include another page from your website that the visitors might be interested in. Chances are, if the users loved the content on one page, they’ll love something similar.
- Don’t оversell. There are many that don’t want to buy the product. At least not immediately. What they want when they visit your website is to be educated a bit more about the product or service. So, instead of just sales-oriented content, incorporate links that tell how the product is used, for what reason, and the result. This is what makes the visitors spend more time on the site.
- Quality content. If you noticed a high bounce rate and low average time on your page, it can indicate that your content is not exactly what people wanted to see, or you didn’t provide enough content for them. What you need to do is review every page and take note where the high bounce rate is and figure out how to include information that keeps the visitors more time on your page.
Besides keeping the visitors on your website, your goal must also be to ensure that they will return again. Provide users with links that are accessible on your website, email newsletters and social media posts. Invite people to become your social media fans and followers to increase your chances of bringing them back.
5. Average Session Duration
This metric shows you the average amount of time that people spend on your website. As a metric, it’s extremely helpful if you want to analyze patterns and trends for your content and web traffic channels.
To check the average session duration for your website, go to Google Analytics, Audience > Overview
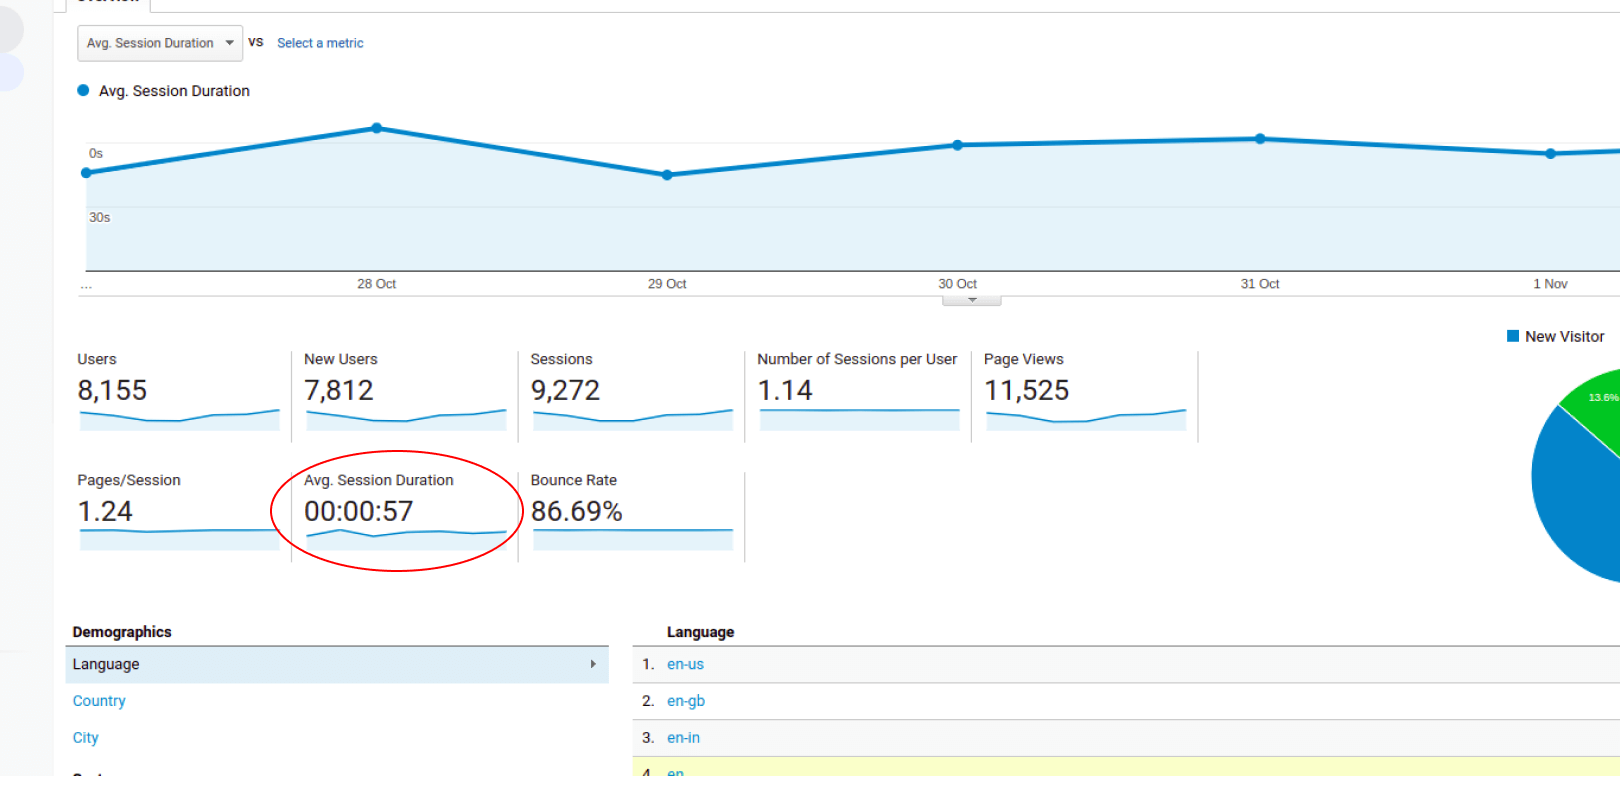
From a content standpoint, you can tell what articles visitors spend most of their time on or what case study gets the most interest from users. This insight will tell you what type of content works the best and what you can use to create similar content.
Take a look at where you get the most traffic from. Figure out the channel that brings you the biggest number of visitors.
For example, if you’ve invested a significant amount on social media advertisement, but you see a low average session duration from a given social network, it means that something is wrong with your target persona or your social media copy.
The average session duration has a different KPI for every page of your website. For example, you can’t expect a bigger ASD for your “About Us” page than your “Blog” page.
Someone spending a long time on a “Contact Us” page or a Landing page is not necessarily a positive sign. Perhaps the user is confused and trying to figure out the next move.
Inspect every page of your website and create an ASD goal for each. This will give you a more focused approach when analyzing it as a metric to include in your lead management KPIs.
6. Exit Rate
In most cases, the web analytics process on any given website review is focused more on the bounce rate.
But, you should also give attention to an underused metric, called Exit Rate. To check your website exit rate, go to Google Analytics and click Behavior > Site Content > Exit Pages
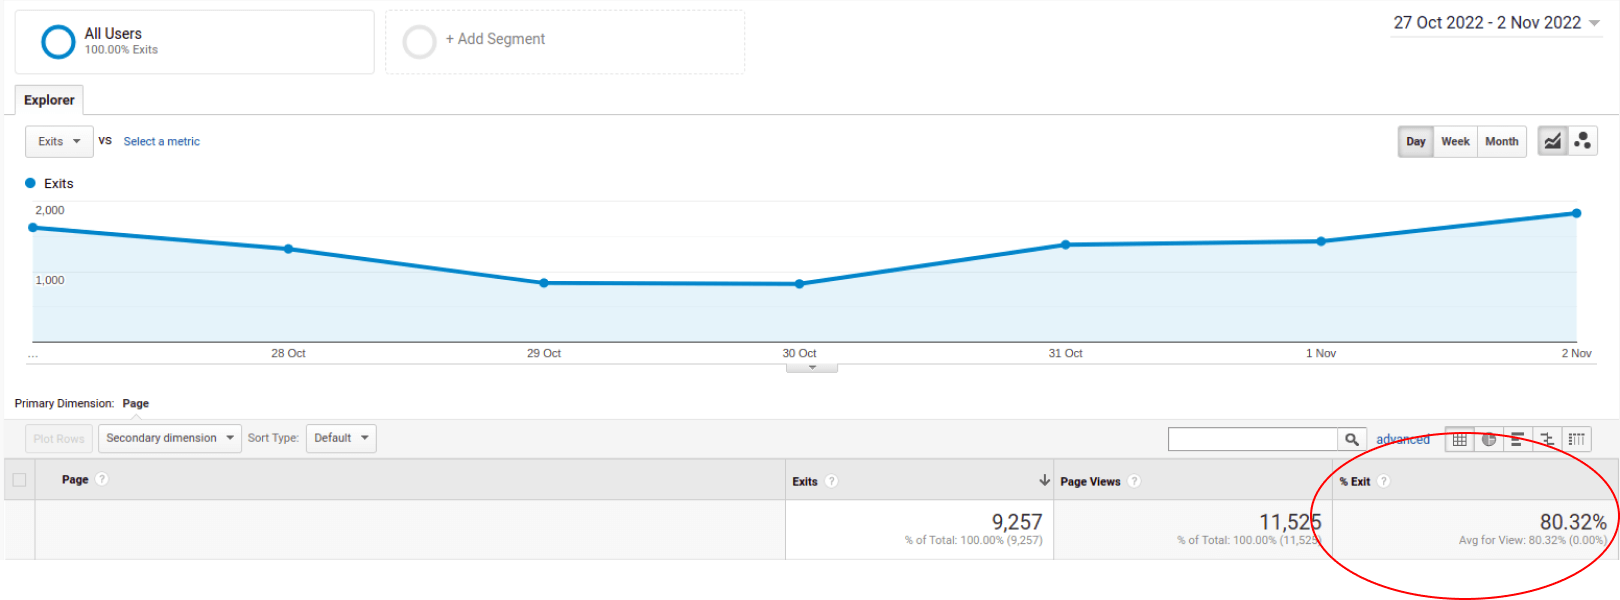
Exit rate as a term used in website traffic analysis (sometimes confused with bounce rate) is the percentage of visitors to a site who actively click away to a different site from a specific page, after possibly having visited any other pages on the site. The visitors just exited on that specific page.
The under use of exit rate as a KPI when it comes to lead management can be supported by the fact that a website visitor can end his visit at any given moment, and you can’t always predict the reason.
Both metrics, bounce rate and exit rate, are important when you measure your website conversion. High bounce rate can mean UX problems.
It can also mean a lack of quality content, slow loading speed, etc. A high exit rate can point to specific issues in your lead conversion funnel.
If your website exit rate is high, it means that something is not right with the page or the content on the page makes potential clients leave moments after they saw it.
If that’s the case, you might need to make some modifications. Determine why visitors leave your website and make changes that will give the users the motive to stay on your page.
Wrapping Up
To have an effective lead management process, you must adopt an analytical marketing mindset. Analyzing the key metrics and determining the right KPIs will help you focus on the rising conversion problems and improve the overall conversion rate by making the right modifications in your content and website.
Identify what your target buyers need at every stage of your conversion funnel, determine and track your key KPI goals, and tweak the process until you ensure that the process is a success.
