So, you’ve brought targeted traffic to your website, and that’s perfect. But, do you know how to drive the users towards your CTA (Call-to-action)?
It’s all about understanding your target users and their journey on your site! Every element of your web pages and all your marketing efforts should be directed towards attracting, engaging, and converting your audience.
So, you need to figure out how to engage the prospects on your website and boost your conversion rates in the process. The more you know about your target audience, the better you’ll be in defining the user journey on your website and developing effective marketing tactics that make site visitors into customers.
What Is a User Journey?

A user journey is the path that a customer takes when using your website to achieve a particular goal. It is the step-by-step process that a person follows to find a solution to their problem. This will often involve visiting multiple website pages and decision points until the user finally achieves what you want them to, i.e. convert to become customers or qualified leads. Therefore, when developing and designing your website, you need to aim to make navigation as smooth as possible.
When you want to develop a user journey, you need to first map out the behavior of the users with solid analytical data. According to Hubspot, a (Customer) User Journey map is:
“a visual representation of the process a customer or prospect goes through to achieve a goal with your company. With the help of a customer journey map, you can get a sense of your customers’ motivations — their needs and pain points.”
A user journey can help you map out the entire process so you can better assess the user map you’ve built benefits you. Also, user journeys show how to make websites simpler and more intuitive. Everyone knows that customers come in all shapes and sizes. However, what many people don’t realize is just how complex their needs can be! Breaking down the user journey into phases helps you understand where each stage falls within your overall sales process. As a result, you can consistently tailor solutions to meet these specific goals along every step of this path. So, maximize the success of your business by solving problems with products or services right when they arise so nobody gets left behind on-track (pun intended)!
Track the Behavioral Stages
The behavior of your website visitors can provide you with sufficient data on how the users think, act, and make their decisions. If you’re not aware of how each one of your pages affects your conversion rate, you won’t know how to effectively optimize it for results.
User behavior and its stages can change depending on the preferences and patterns of the users. Therefore, it is critical to learn how visitors currently behave on your site.
One of the best analytics tools for this purpose is Google Analytics. GA can tell you nearly everything about user behavior on your website, including:
- User Entry: How the users arrive on your website.
- Behavior Flow: Where do the users go when they arrive on your website.
- Engagement: How do users engage with your website.
User Entry
Open your GA, and head to “Behavior” and click “Behavior Flow”. You will be presented with the following chart:
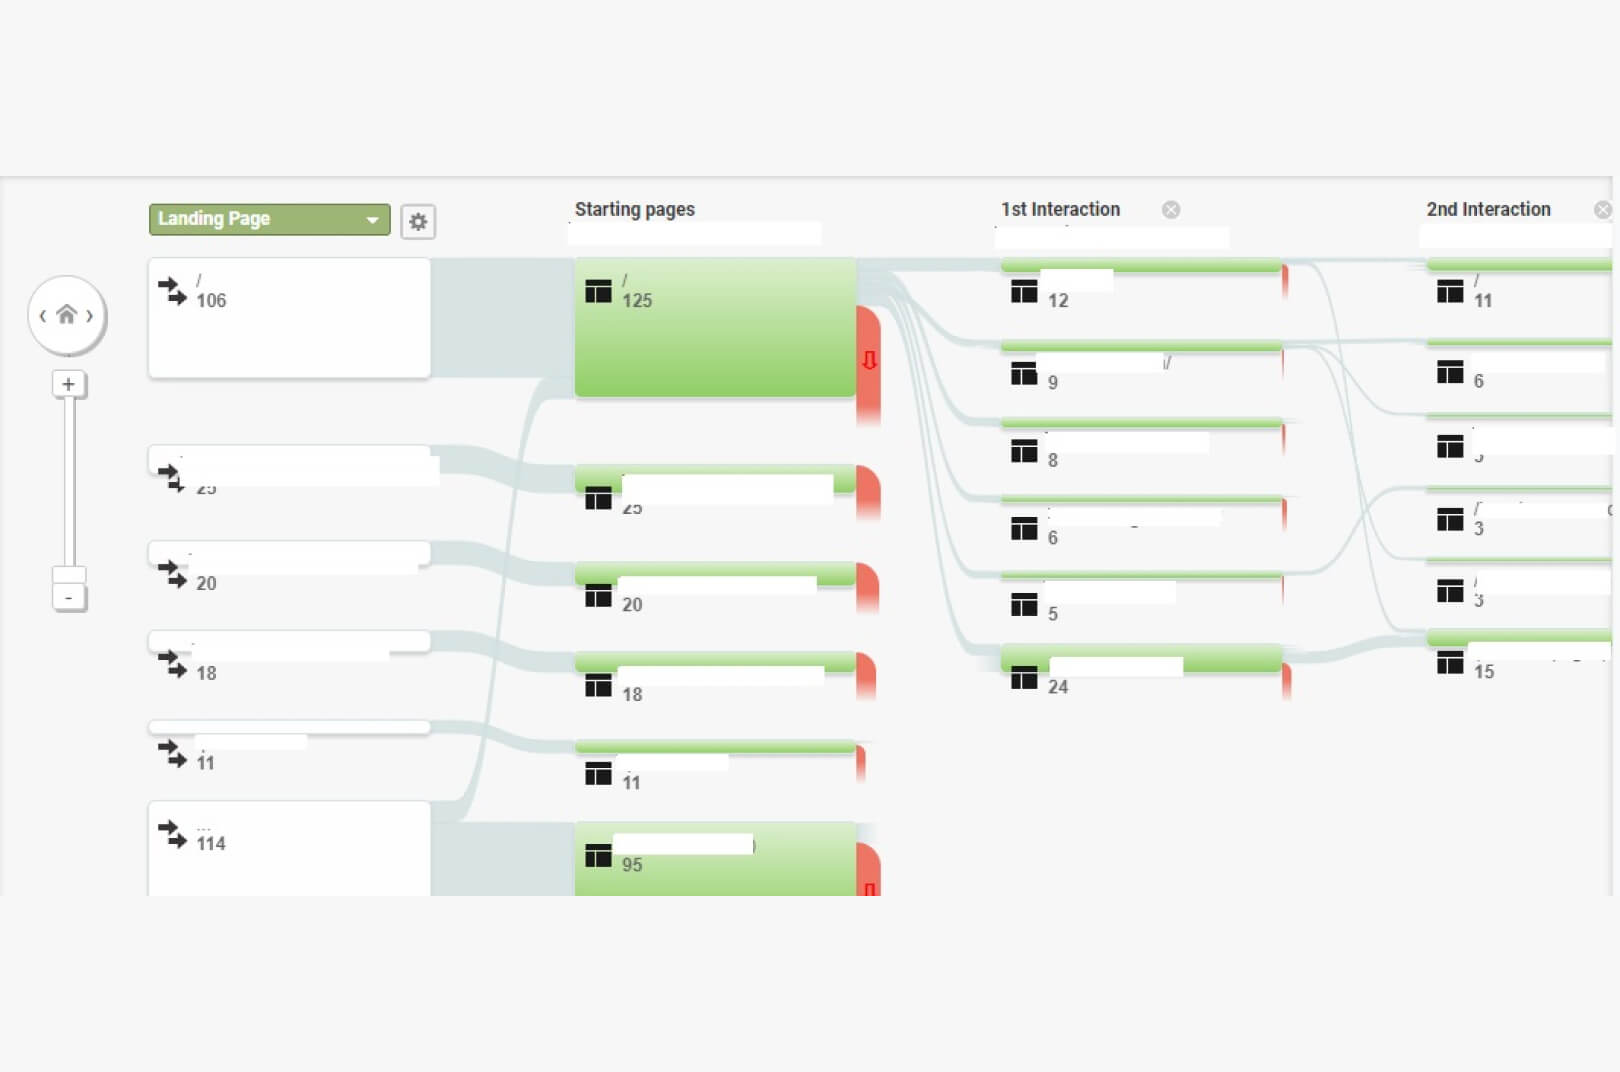
The first column of the chart, called “Landing Page”, is the first URL of your website that users enter, or in other words, the first page users arrive on.
As you can see, the landing page takes the users through several other pages, all the way to their final destination. You need to investigate all of these pages and define where, how, and why the users are redirected from one specific page to another.
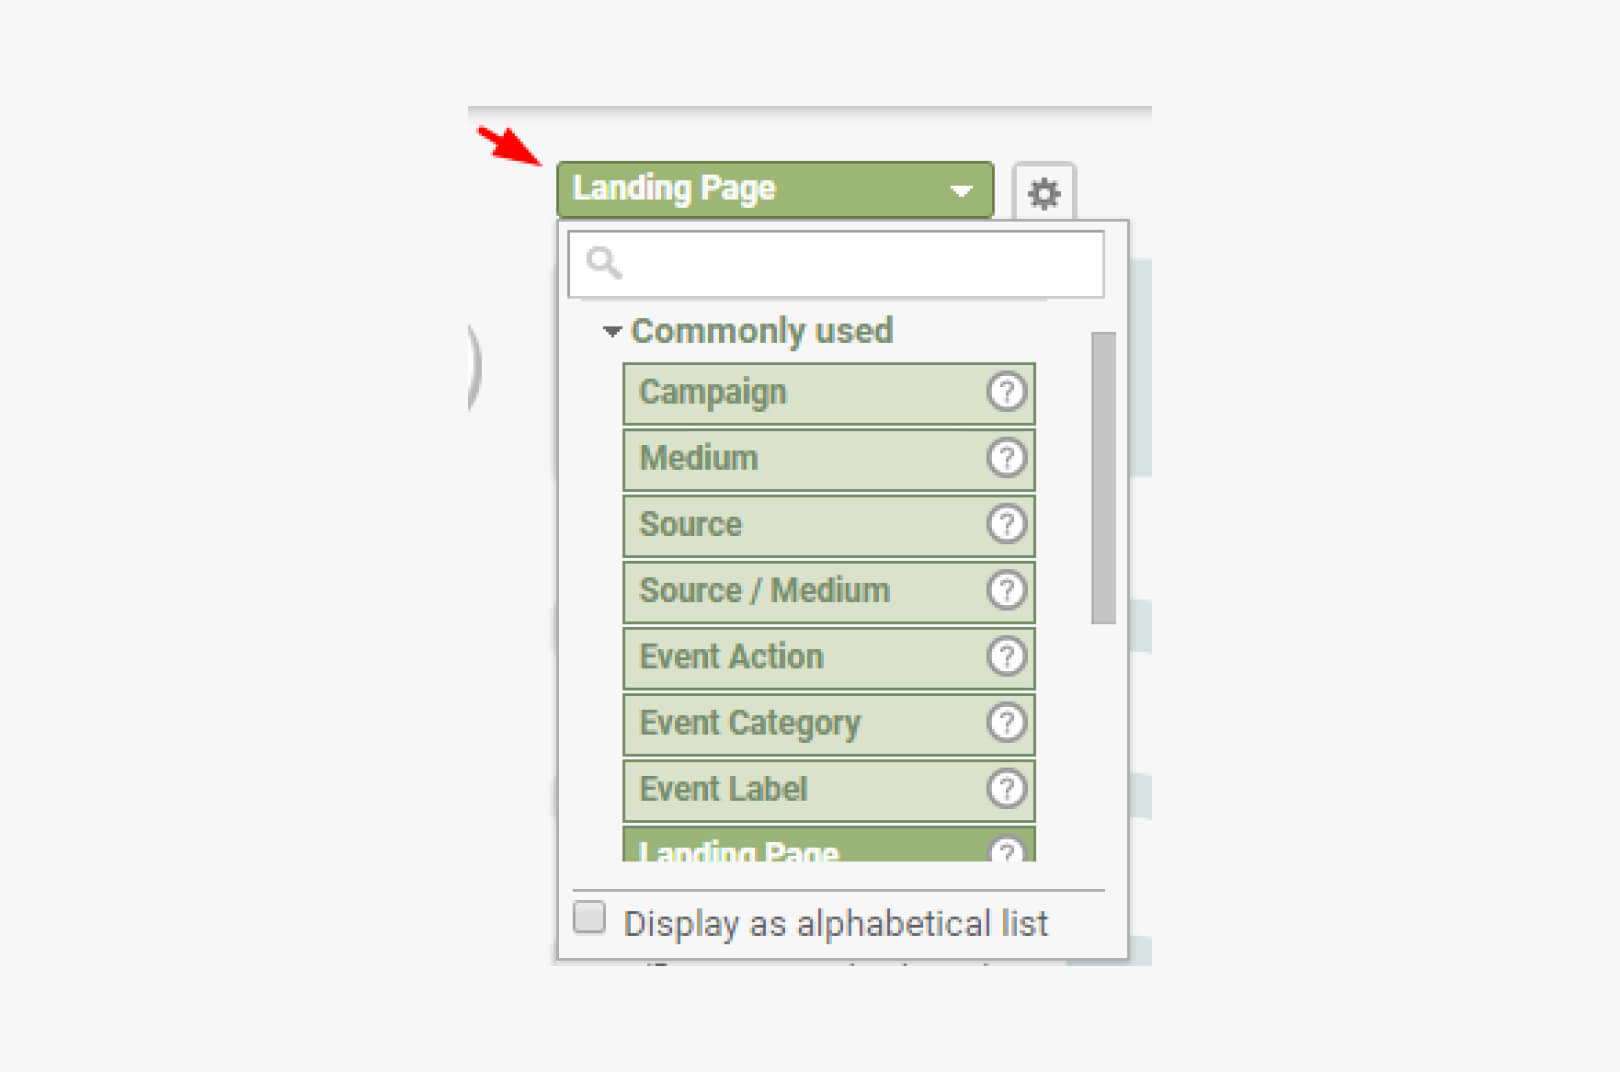
If you want to get more information on why the users enter these specific pages, you can add a modifier to your Behavior Flow chart. Just click on the dropdown menu on the upper-left hand corner of the chart, and pick the variable that you want to add:
For example, if you select Acquisition → Default Channel Grouping, you’ll get an analysis of your main traffic sources.
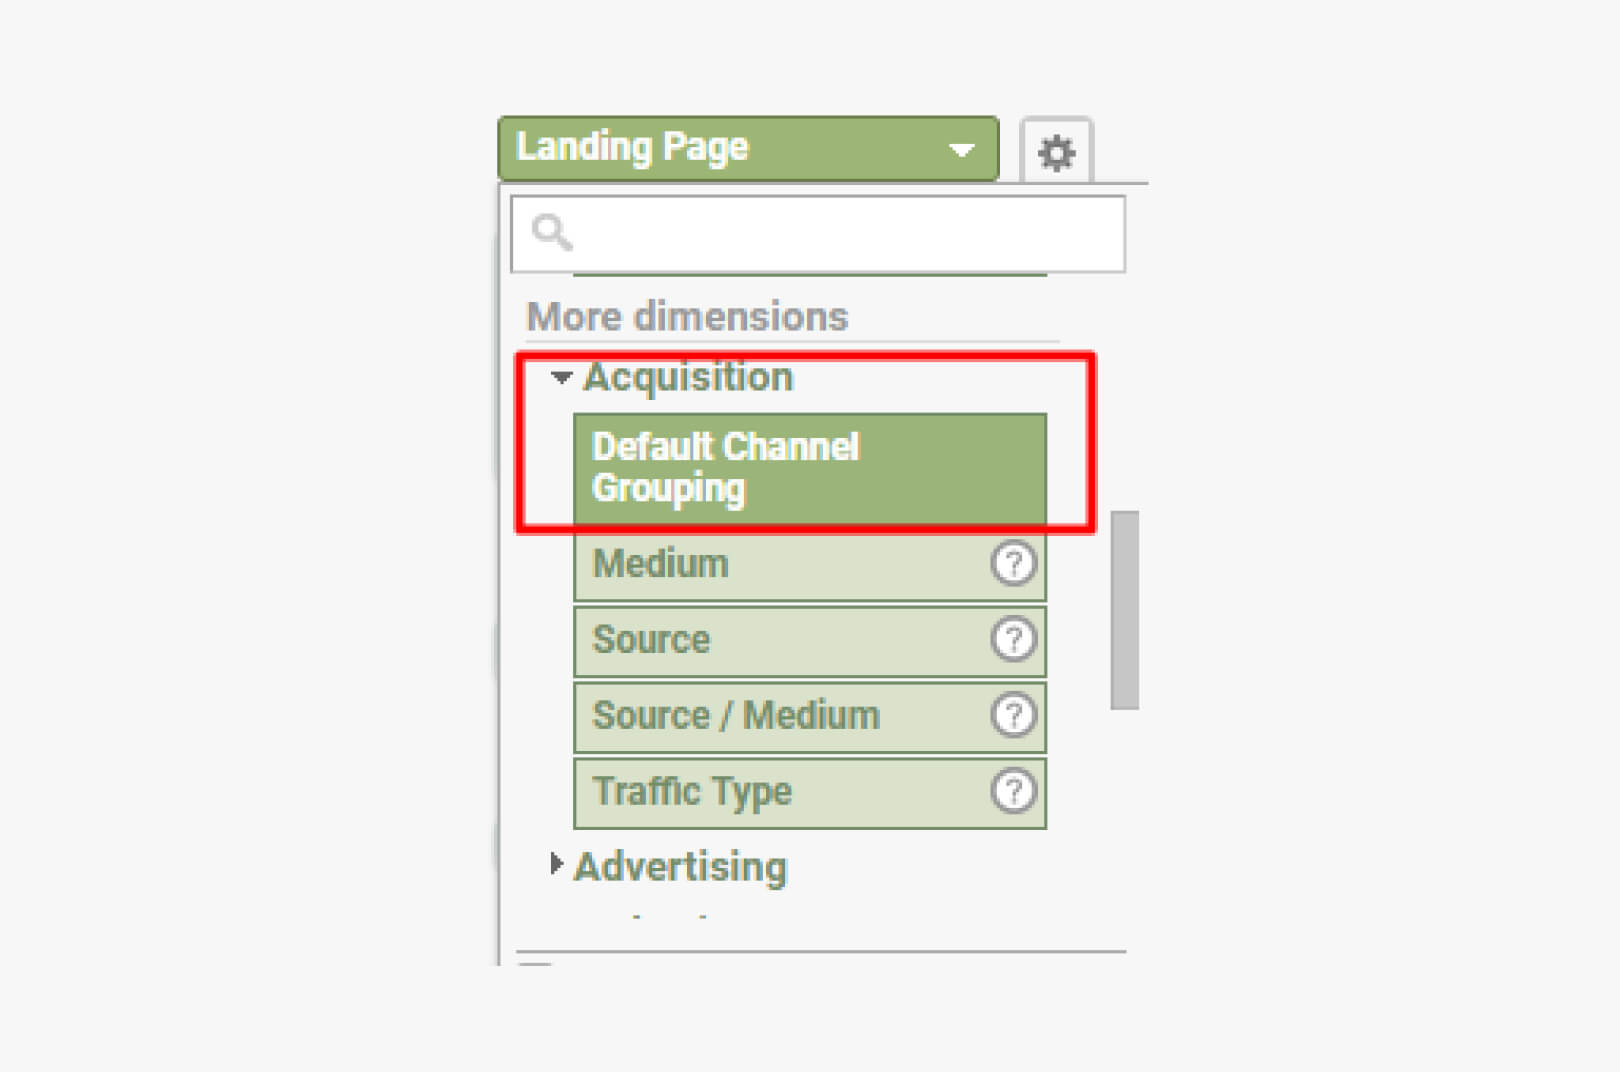
This report can help you grasp why some of your pages get more traffic than others, and how the user journey continues from there. You need to work on enhancing the most popular landing pages of your site to improve overall first impressions.
Behavior Flow
By now, you’re already familiar with the GA’s Behavior Flow chart above. At this point, as opposed to looking at the entrance pages, you can examine how the users interact with other parts of your site. Essentially, the behavior flow report displays exactly where the target users go after the initial entry.
Each new page that the user opens after the entry represents the first, second, third interaction, and so on. Besides the flow chart, there are also other valuable sources of behavior insights that you can get with GA. You can simply go to Behavior → Overview.
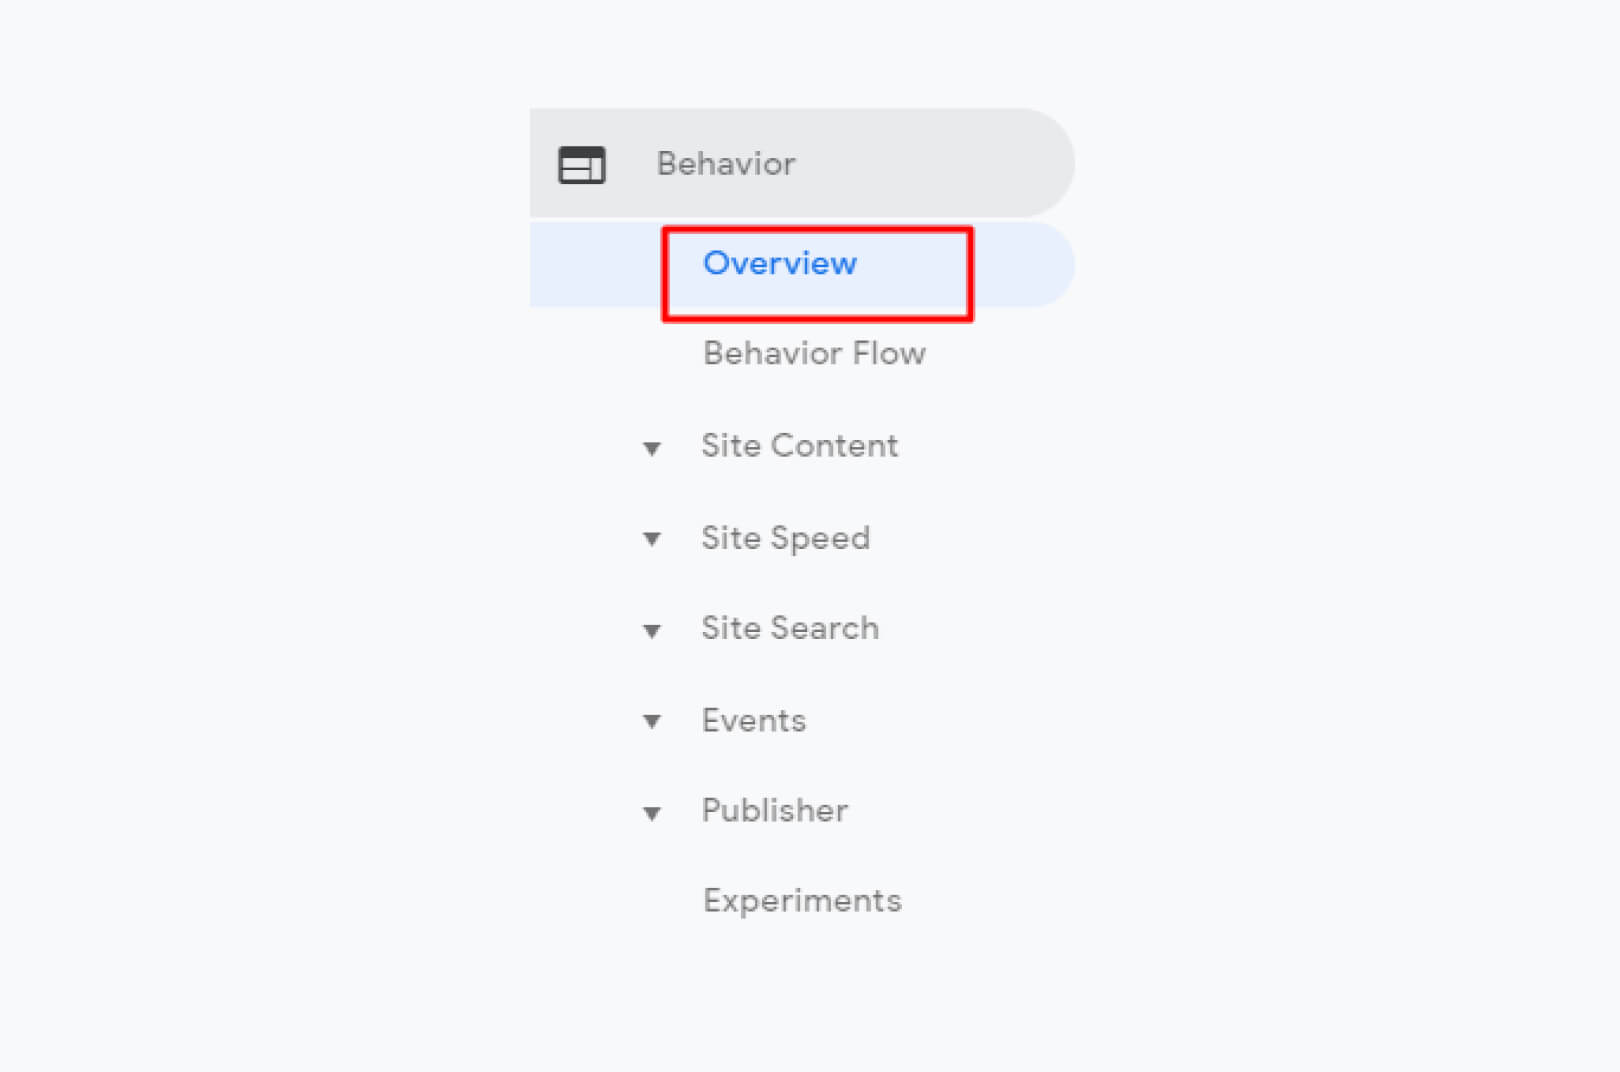
In this report, you’ll find some key insights about the general behavior, including the average time that a user spends on your website, the collective bounce rate, and the most visited pages of your website. The key insights that you need to keep an eye for are:
- Bounce Rate: Which are the pages where you fail to convert your visitors? There can be lots of reasons for the high bounce rate of these pages, it may be the lack of quality content or an intrusive feature that pushes the users away.
- Major Connections: Look at the Behavior Flow report, and see which of your internal pages and how long do the users stay on them. The higher the number of interactions is, the better is the user flow of your website.
- Traffic: What are the pages that get the most traffic? What sets these pages apart from others on your website? And what makes people want to visit them?
Bottom line, in order to understand user behavior on your site, you need to be constantly informed with the latest site performance data from your Google Analytics account. The next logical step in defining the user journey on your website is to take applicable steps and improve the customer experience.
Define the Behavioral Phases

Building a high-converting user journey requires excellent understanding of your target customers, their needs, motivations, and habits. Before you define the behavioral stages, you need to validate your customer personas:
- Where are your customers located?
- What are their spending habits?
- What is their budget?
- What is their average age?
- What are their habits, hobbies, occupations?
- In which industry do they work?
- How do they access your products/services?
- How do they access your website?
By now, you may already have the information that can help you to get a better grasp on your customer personas. Additionally, you can collect feedback from your current customers who have already interacted with your brand:
- How did they find out about your company?
- What attracted them to your website?
- What are the goals that they want to achieve on your website?
- How much time do they spend on your website?
- How easy is for them to navigate on your website?
- Is there any way to make the process of using your website easier for them?
When you have your customer personas in place, you need to investigate what they want to achieve as they navigate through your website. Understanding and defining customer goals is critical when you want to develop a user journey map.
Think about what the goals that the customers want to achieve are, and see if your website is able to sustain them.
Define the Touchpoints

A “touch” happens every time a target user comes into contact with your company. This also embodies your website as well!
Based on your customer persona and user behavior research, you need to be aware of all the touchpoints that prospects make on your website, as well as the touchpoints that you prefer them to make . If the user journey generates fewer touchpoints than you’d expect to, you may need to optimize your website better to achieve a lower bounce rate.
On the contrary, more touchpoints than necessary can indicate that the user journey on your website is too complex. Remember, a touchpoint doesn’t only occur on your company website. In the user journey, you can also include a paid ad, email marketing, social media mentions, and a link from another site that mentions your company.
The actions that your target customers take when they engage with your company could be from a Google search to clicking a link in an email newsletter or a social media post. Each of these actions is driven by emotions. This motive can be their pain point, the problem that they want to solve with your help!
Being aware of their pain points should direct you towards providing the content and the layout that will help them uncover the solution on your website.
Fix the Obstacles
Is there something that you can fix on your website to improve the user journey? Or, you need to rebuild design elements all over again or make small alterations that can boost your conversion rate?
For example, some users might complain about a certain feature, and if that happens frequently, you need to do something about it. The end objective of your pages should always be to drive prospects down the funnel and convert them. Ultimately, you should always aim to convert your web visitors, and every retouch on your pages should facilitate that goal.
Set up Your Website

When you want to align your website for a maximum user journey effect, you need to start with a plan! Think about your company mission, vision, goals, and the approaches that can help you achieve them. You need to also put yourself in the users’ shoes and understand what they want to see on each of your pages. The end goal is to incorporate each web element based on your buyer persona.
Focus on UX
A positive experience with your website can make all the difference. When improving your UX, here’s what you need to focus on:
- Speed: There are no longer excuses for having a slow website. There are numerous ways to improve your website’s speed immediately, including the usage of a caching plugin, image optimization, database optimization, minifying CSS and JavaScript, reducing HTTP requests.
- Clear CTA: You need to know how to highlight your CTA. Have a clear message, with the right typography, colors, and tone. The CTA needs to be positioned in a way that makes the entire visual experience of your page far better.
- Scannable Content: Format your content to be scannable so users won’t have any obstacles when they browse your site. This will reduce their task errors and the bounce rate, and will help them comprehend what you want to communicate.
Improve the Navigation
One of the most important characteristics of an excellent customer journey is faultless web navigation. This is vital if you want to keep the users on your site and can make or break your conversion rate.
Navigation on a website is achieved by links that allow the user to browse through different pages. With a website’s navigation menu, your users can find the information they need fast. The collection of links that make up the website navigation bar usually appear vertically on the left or horizontal near top and sometimes at footer area too!
The navigation of your website is an important factor for people to explore and enjoy the site. A messy, unorganized layout will make them feel lost along their journey which could push them away from your business. So, if you don’t want to chase the users away, here’s what you need to improve when it comes to web navigation:
- Limit the Number of Menu Items: In general, the menu selection items shouldn’t be more than 7-8. Users might not have a lot of time to spend on your site, so organize your content in less than ten categories. Too many categories can lead to indecision anyway.
- Don’t Deceive the Users: Never have misleading or inaccurate titles or links that can damage the user journey. It is one of the biggest reasons for site abandonment. Misleading them will be catastrophic not only for your brand reputation but for the entire site UX as well.
- Include Image Alt Text: If your images are clickable, you need to give them an alt attribute with text that is matched with the page that is linked. With that, you’ll let users know that there’s a link behind the image and that they can click it.
- An Obvious Search Box: One of the most utilized options on a website is its search box. Thus, it is a vital component of every web navigation. A search box can provide users with easy access to the information they need. The ideal place for any search box is at the top of the sidebar, or in the header area of the page.
- Use Colors Wisely: Colors can make a difference when you want to separate one component of your website from another. You can use one color for the navigation bar so it can be apparent to users. If the background of your site is bright, you can use a softer color for the navigation bar, and vice versa.
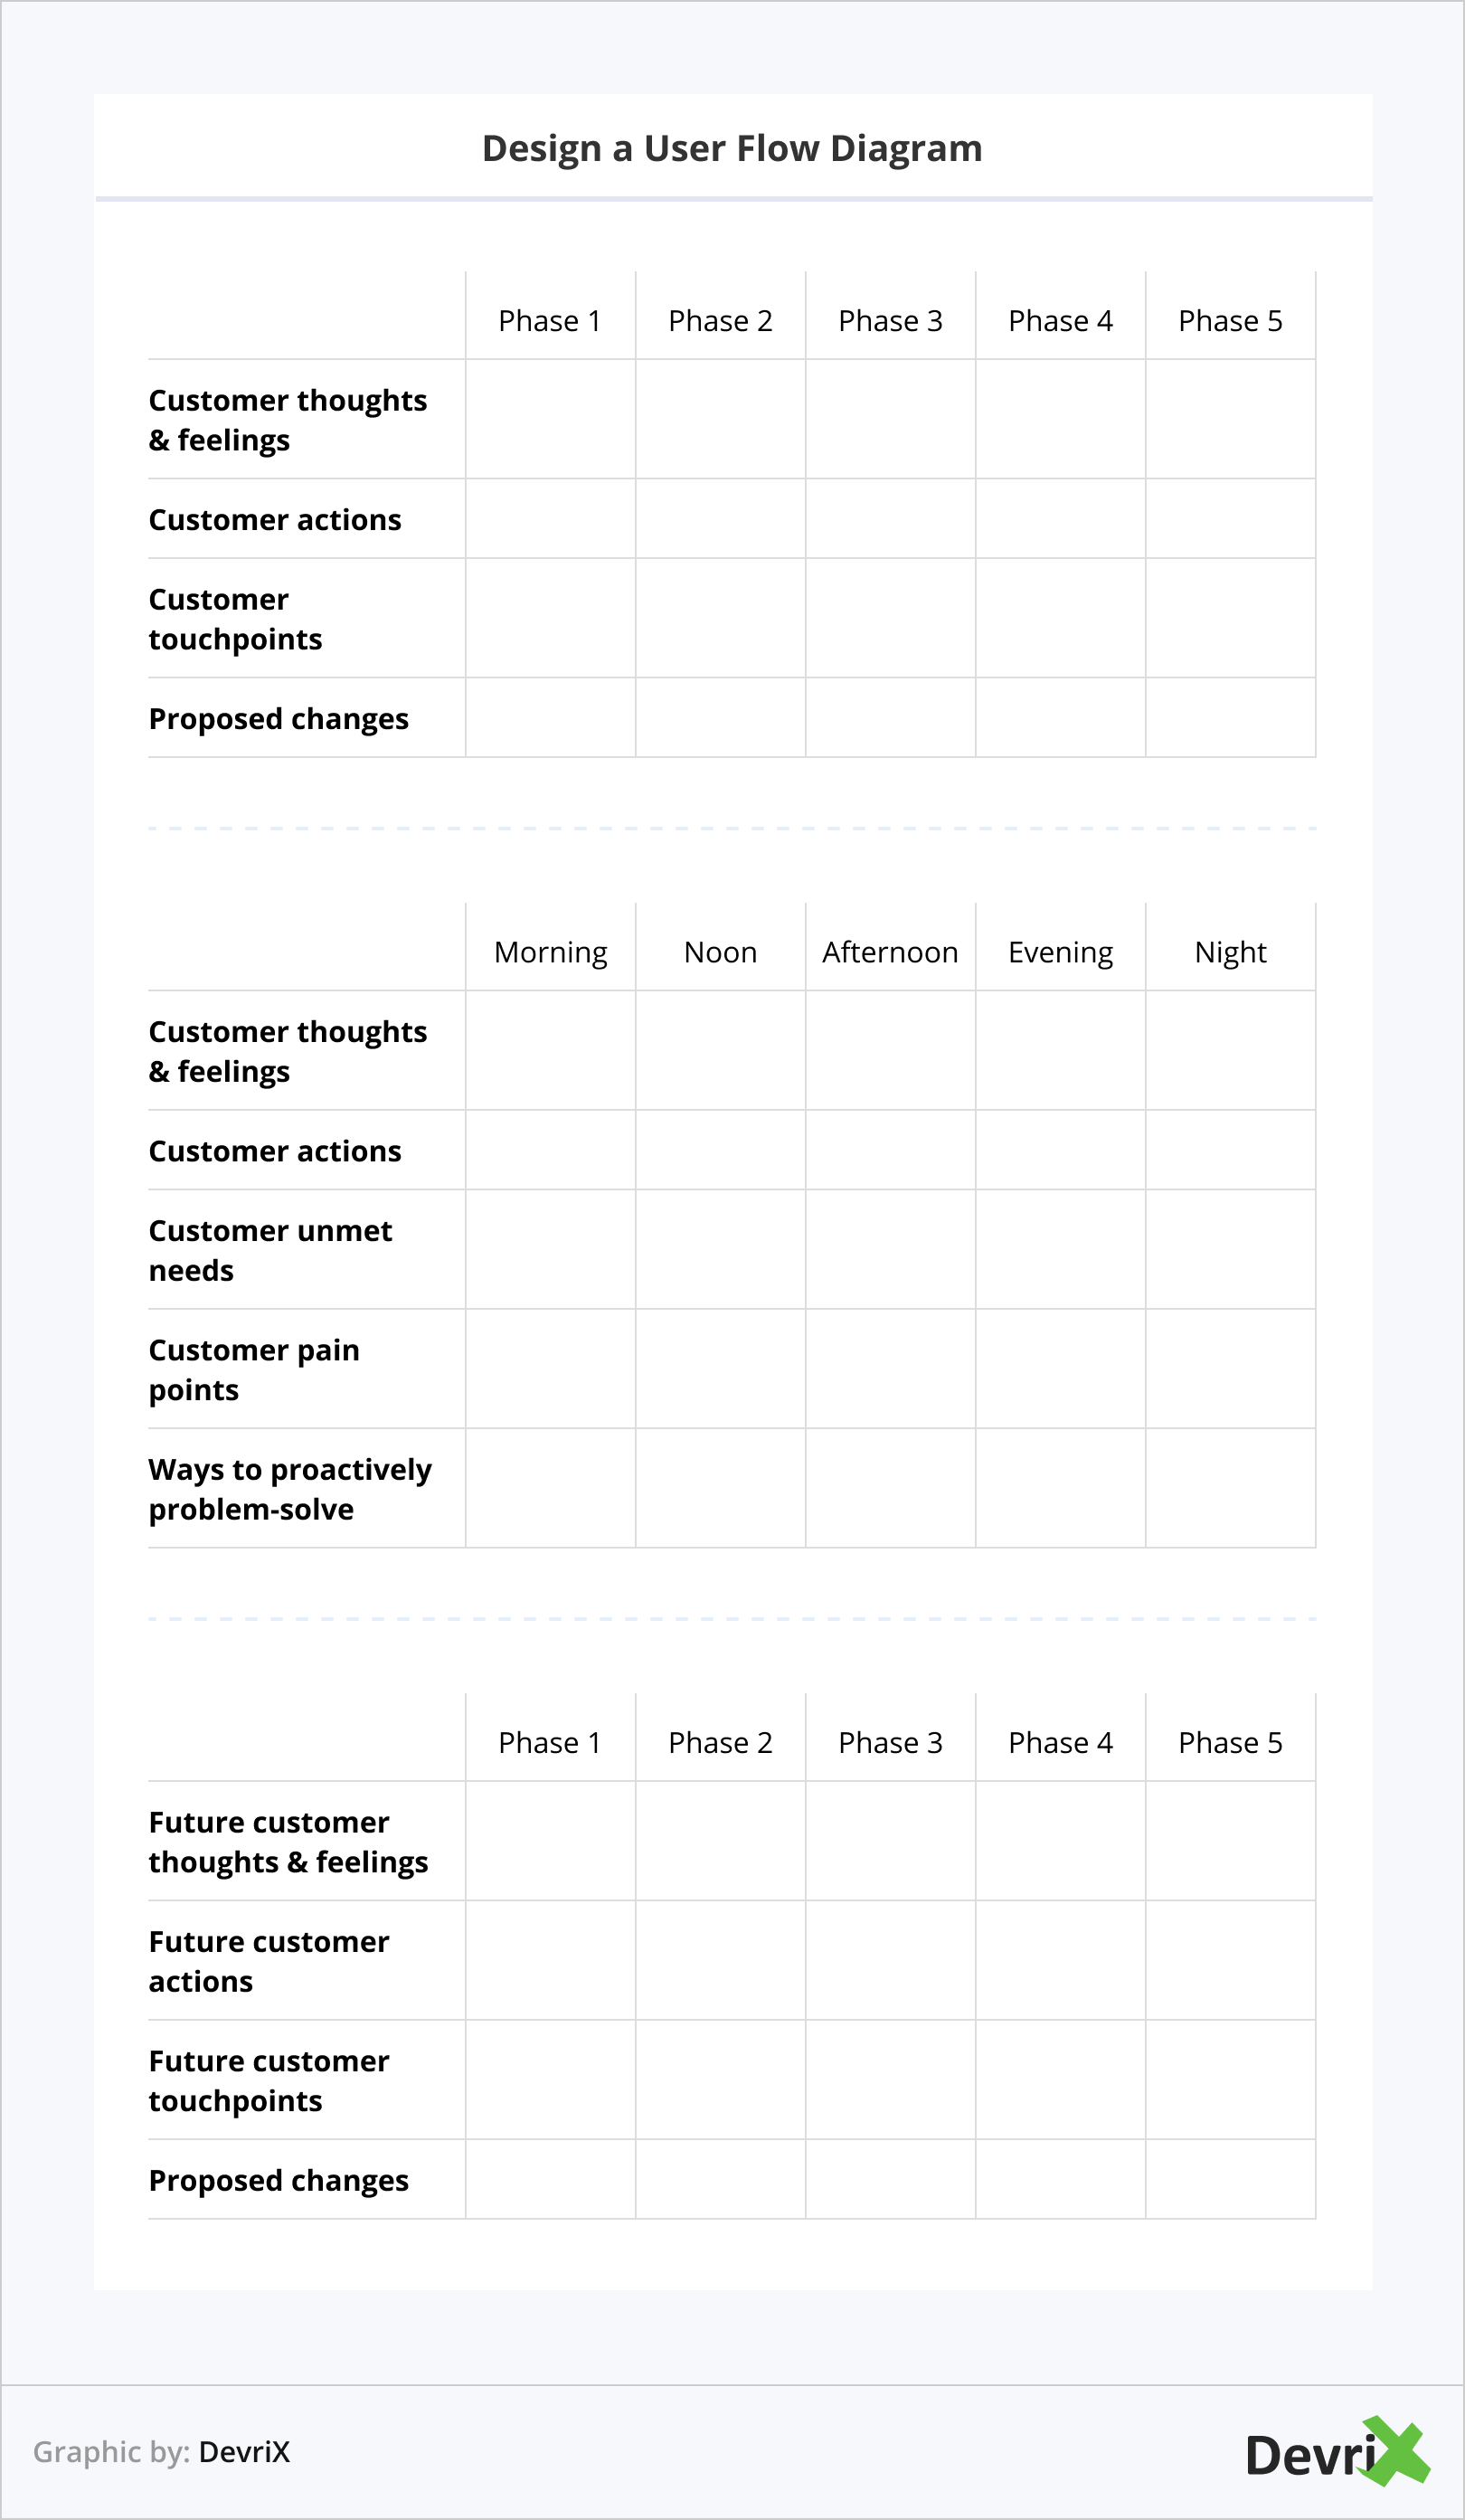
Design a User Flow Diagram
The best way to summarize the user journey of your website is to create a user flow map or a diagram. A diagram can help you work out what it will take for the users to complete the desired action, such as signing up for a newsletter or purchasing your product.
According to Neil Patel, the best user flows are simple and geared towards action. The mapping process alone is what helps you to keep users in the funnel and define where your goals will meet their needs. When you know where users interact the most, you can focus your efforts for maximum conversions.
If you already have your Google Analytics behavior flow data ready, you can easily map out and redefine the user journey. The best way to achieve this is either using a spreadsheet or a flowchart/wireframing tool.
As we mentioned before, the user journey doesn’t have to be complicated. But, it needs to be helpful enough so you’ll be able to improve the weak spots of your sales funnel. With that being said, a simple user flow spreadsheet may look like the following ones below.
Of course, you can opt for user mapping tools, such as:
Wrapping Up
Knowing what kind of experience the users have on your website is essential for increased conversion rates and long-term business growth. When you envision how they interact with your platform, you can estimate the time a user stays on the pages, or leaves the page, and provide a better user experience for your existing and prospective customers.
Now, it is time to take everything that you’ve learned from this article and apply it in order to make a significant change towards your business goals! When you provide the best possible user experience from start to finish, you can enhance client satisfaction and improve your sales and customer retention rate.
Team DevriX
This article is crafted by DevriX's seasoned marketing team, boasting over four decades of collective expertise in crafting sophisticated marketing funnels, devising comprehensive content frameworks and pillars, implementing engaging email campaigns, and creating impactful social media content designed for scalability.
Our marketing experts specialize in the complete spectrum of inbound marketing strategies. As an accredited HubSpot Agency Partner and a Semrush Partner, we engage in meticulous research, blending our extensive experience with the unique insights of our highly skilled team.
We set benchmarks in content creation by incorporating cutting-edge marketing trends, leveraging in-depth industry research, and utilizing state-of-the-art AI tools for data segmentation and captivating content hooks. Our proficiency extends across a diverse range of sectors, including working with SMEs, Fortune 1000 companies, global B2B brands, major publishing entities, WooCommerce platforms, business directories, and affiliate networks.