Marketers have a huge array of tools at their disposal. Their goal is to help them understand how many users visit their websites, their demographics, psychographics, and the way they interact with sites.
We all know about Google Analytics, and Google Search Console, which can provide valuable insights on traffic, search, and so on. But, what if we told you that you can use a tool to actually see where users are clicking on your website?
You can. It is called heatmap software. Now, let us learn more about heat mapping, and how marketers can use it to their advantage.
Readers Also Enjoy: 43+ Best Tools for Successful Content Marketing – DevriX
What Is a Heatmap?
Essentially, a heatmap is a graphical interface of data collected from user interactions on a website.
Here is what it looks like:
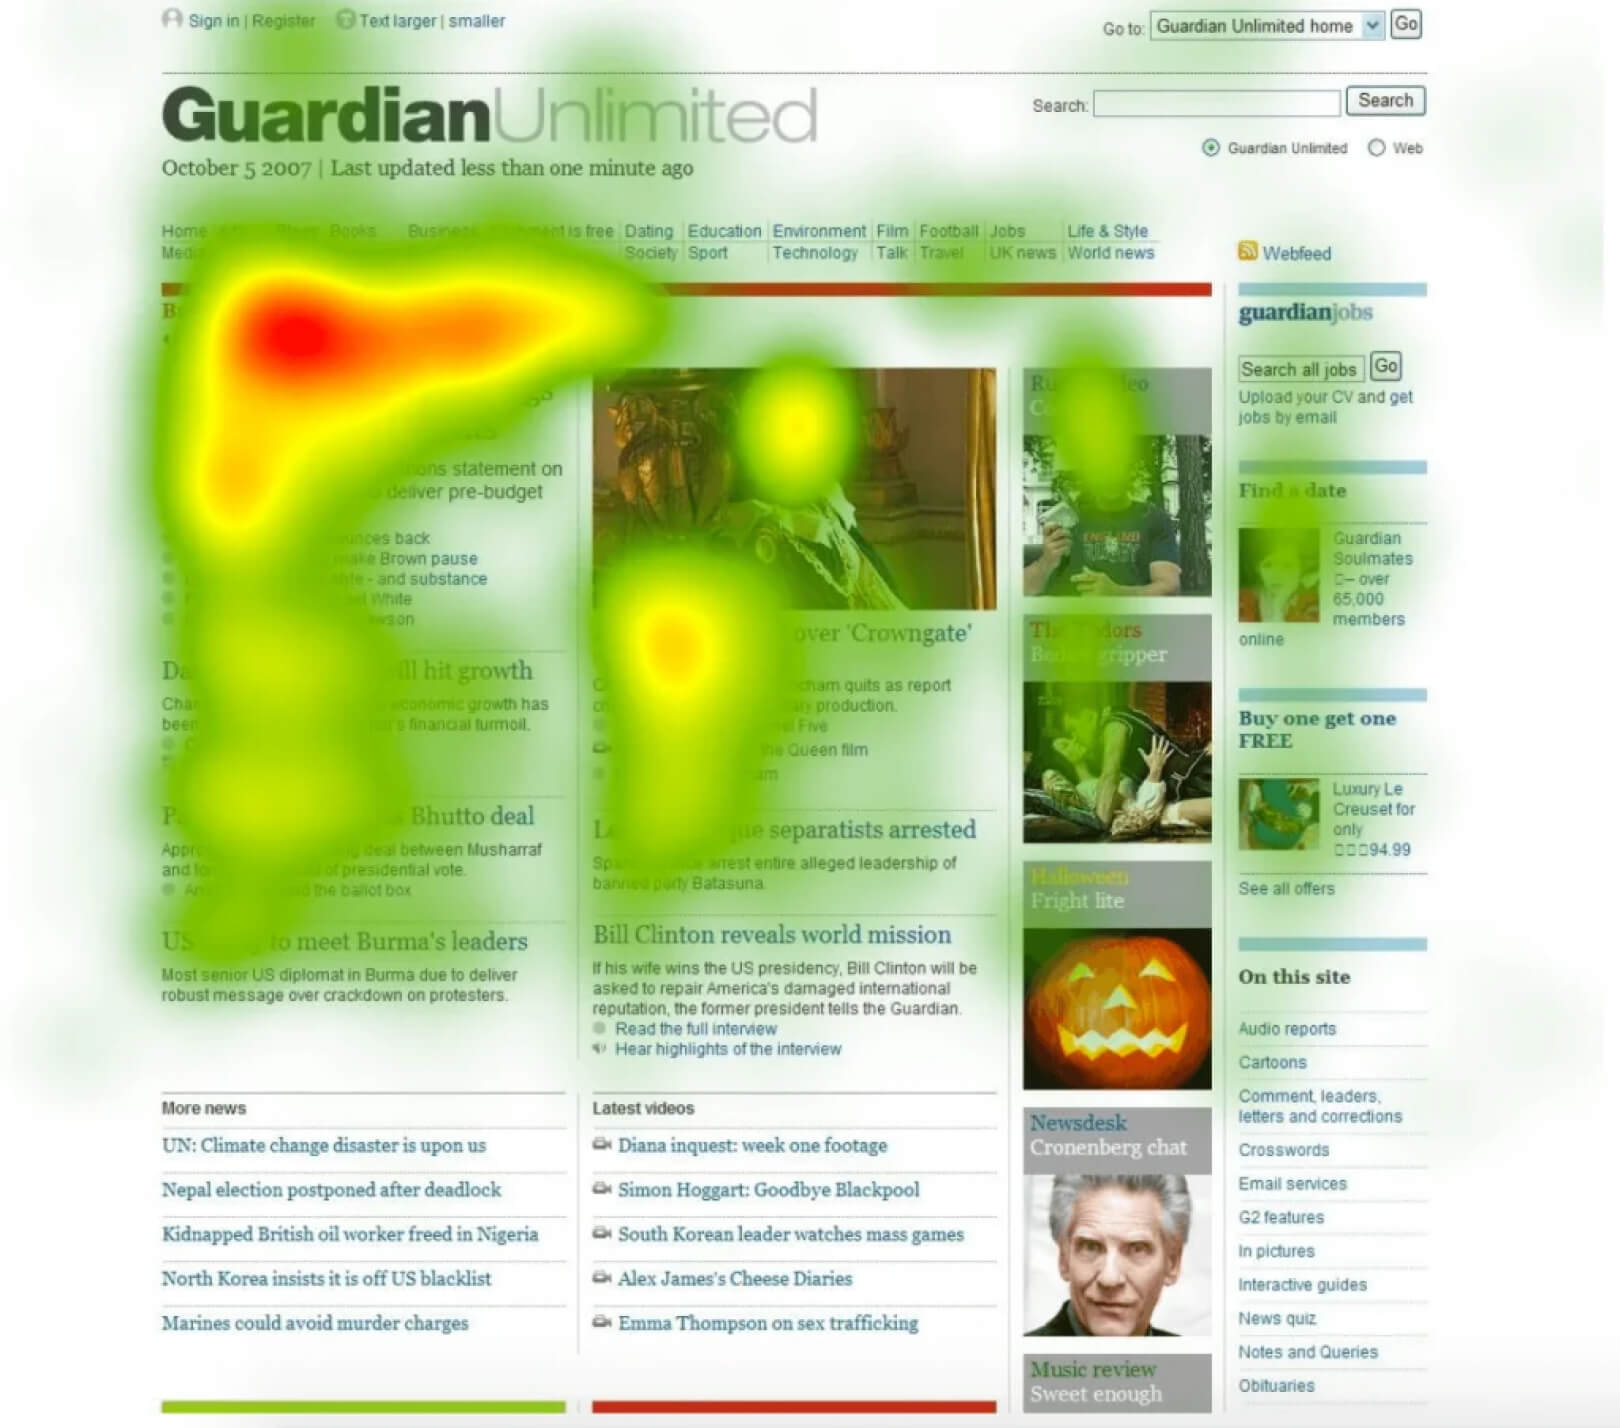
The red is an indication of the most popular content on the page, or the elements of the page, where the users clicked on the most.
Of course, not all heatmap software looks exactly the same. There are different types.
Readers Also Enjoy: What Is Audience Analysis & Why Is It Crucial for Your Business? – DevriX
Types of Heat Maps
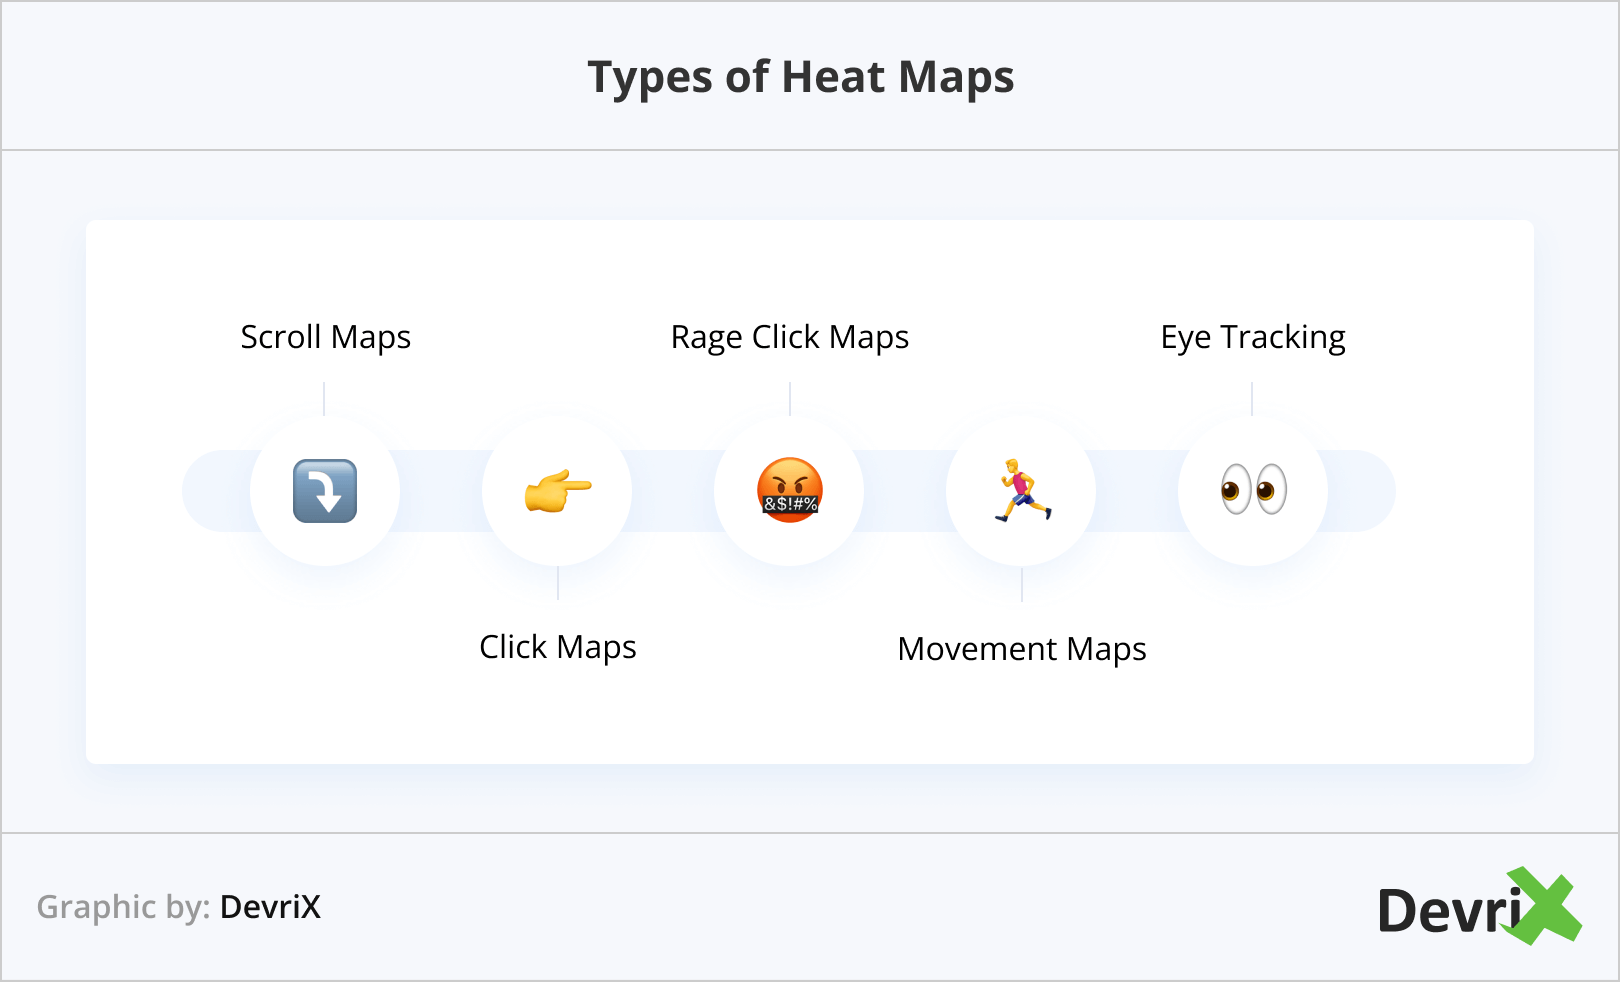
- Scroll Maps
- Click Maps
- Rage Click Maps
- Movement Maps
- Eye Tracking
1. Scroll Maps
As the name suggests, scroll heat maps show how far down users have scrolled on a page.
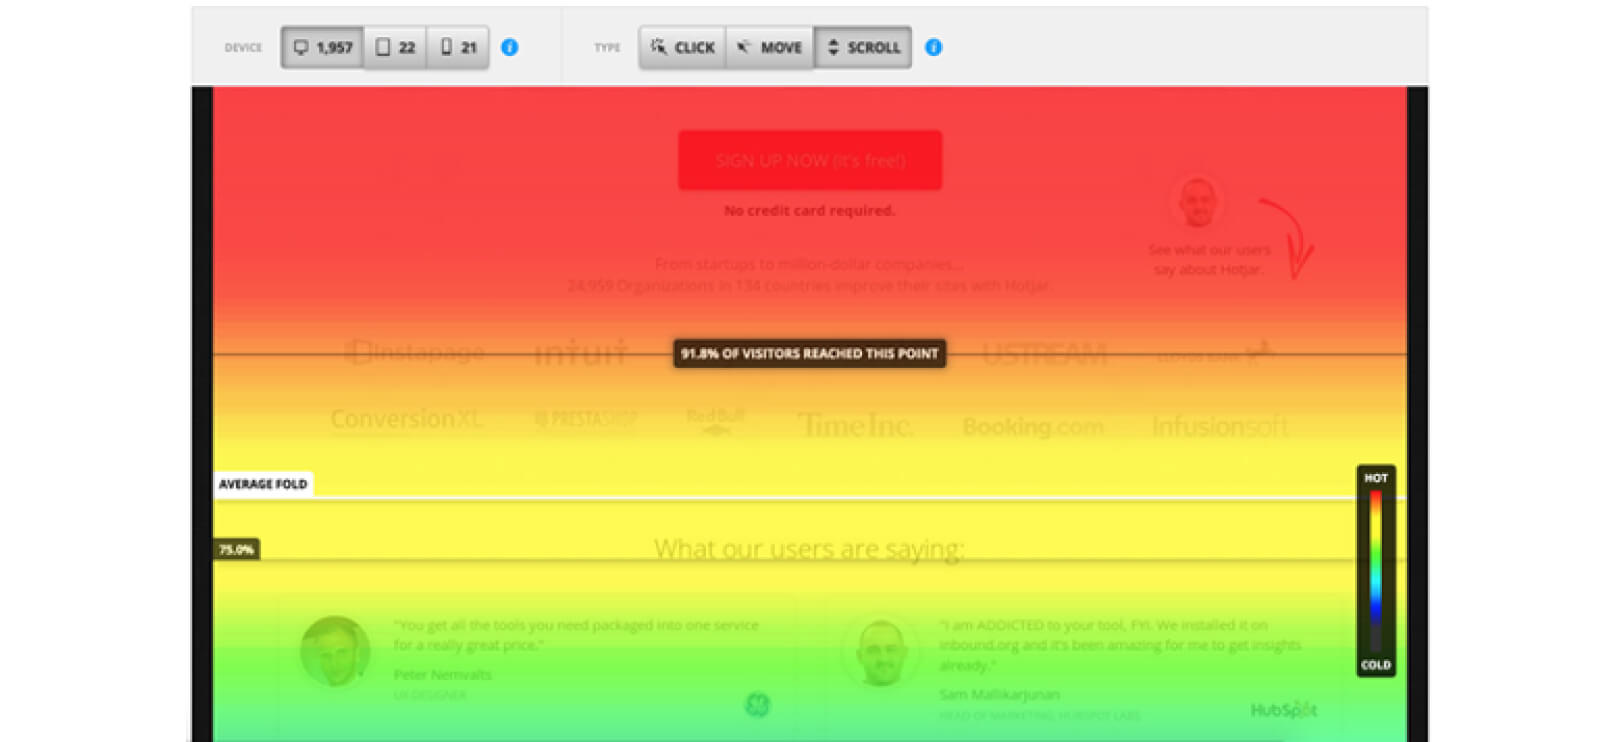
This is a great way of figuring out whether your above the fold content works, and if your content further down the page is engaging enough for users.
Readers Also Enjoy: GA4 Metrics Explained: User Behavior Cheat Sheet – DevriX
2. Click Maps
We showed one of these in the first example. Again, click heat maps showcase the exact places where users click (or tap) on the page.
Readers Also Enjoy: What are GA4 Explorations and How to Use Them – DevriX
3. Rage Click Maps
Have you ever started furiously clicking on a place on a page? Yes, that also gets registered in the rage click maps. More often than not, users rage click on elements where they expect there to be a button/link.
Using this knowledge, you can provide a better user experience and add said buttons/links, where users anticipate there to be such.
Readers Also Enjoy: How to Use Heatmaps to Improve the UX of Your Website – DevriX
4. Movement Maps
Movement maps provide data about where users move their cursors while browsing your website. This gives a more complete picture of exactly what people are doing while they are on your site.
Readers Also Enjoy: WordPress Playground: The Future of Web Development? – DevriX
5. Eye Tracking
Yes, even your eye movement is being tracked. Relax, it is not a Clockwork Orange scenario…
Instead, this heatmap shows the path of a user’s eye movements as they look at a webpage.
In reality, an eye tracking heatmap gathers and presents data regarding the sections and elements that capture the most and least attention on a web page.
Data is collected regarding the number of times a visitor examines individual elements and the duration of their fixation, which is subsequently displayed in the form of an eye tracking heatmap.
Readers Also Enjoy: What Is Semantic AI: Importance, Applications, Benefits – DevriX
The Benefits of Heatmaps
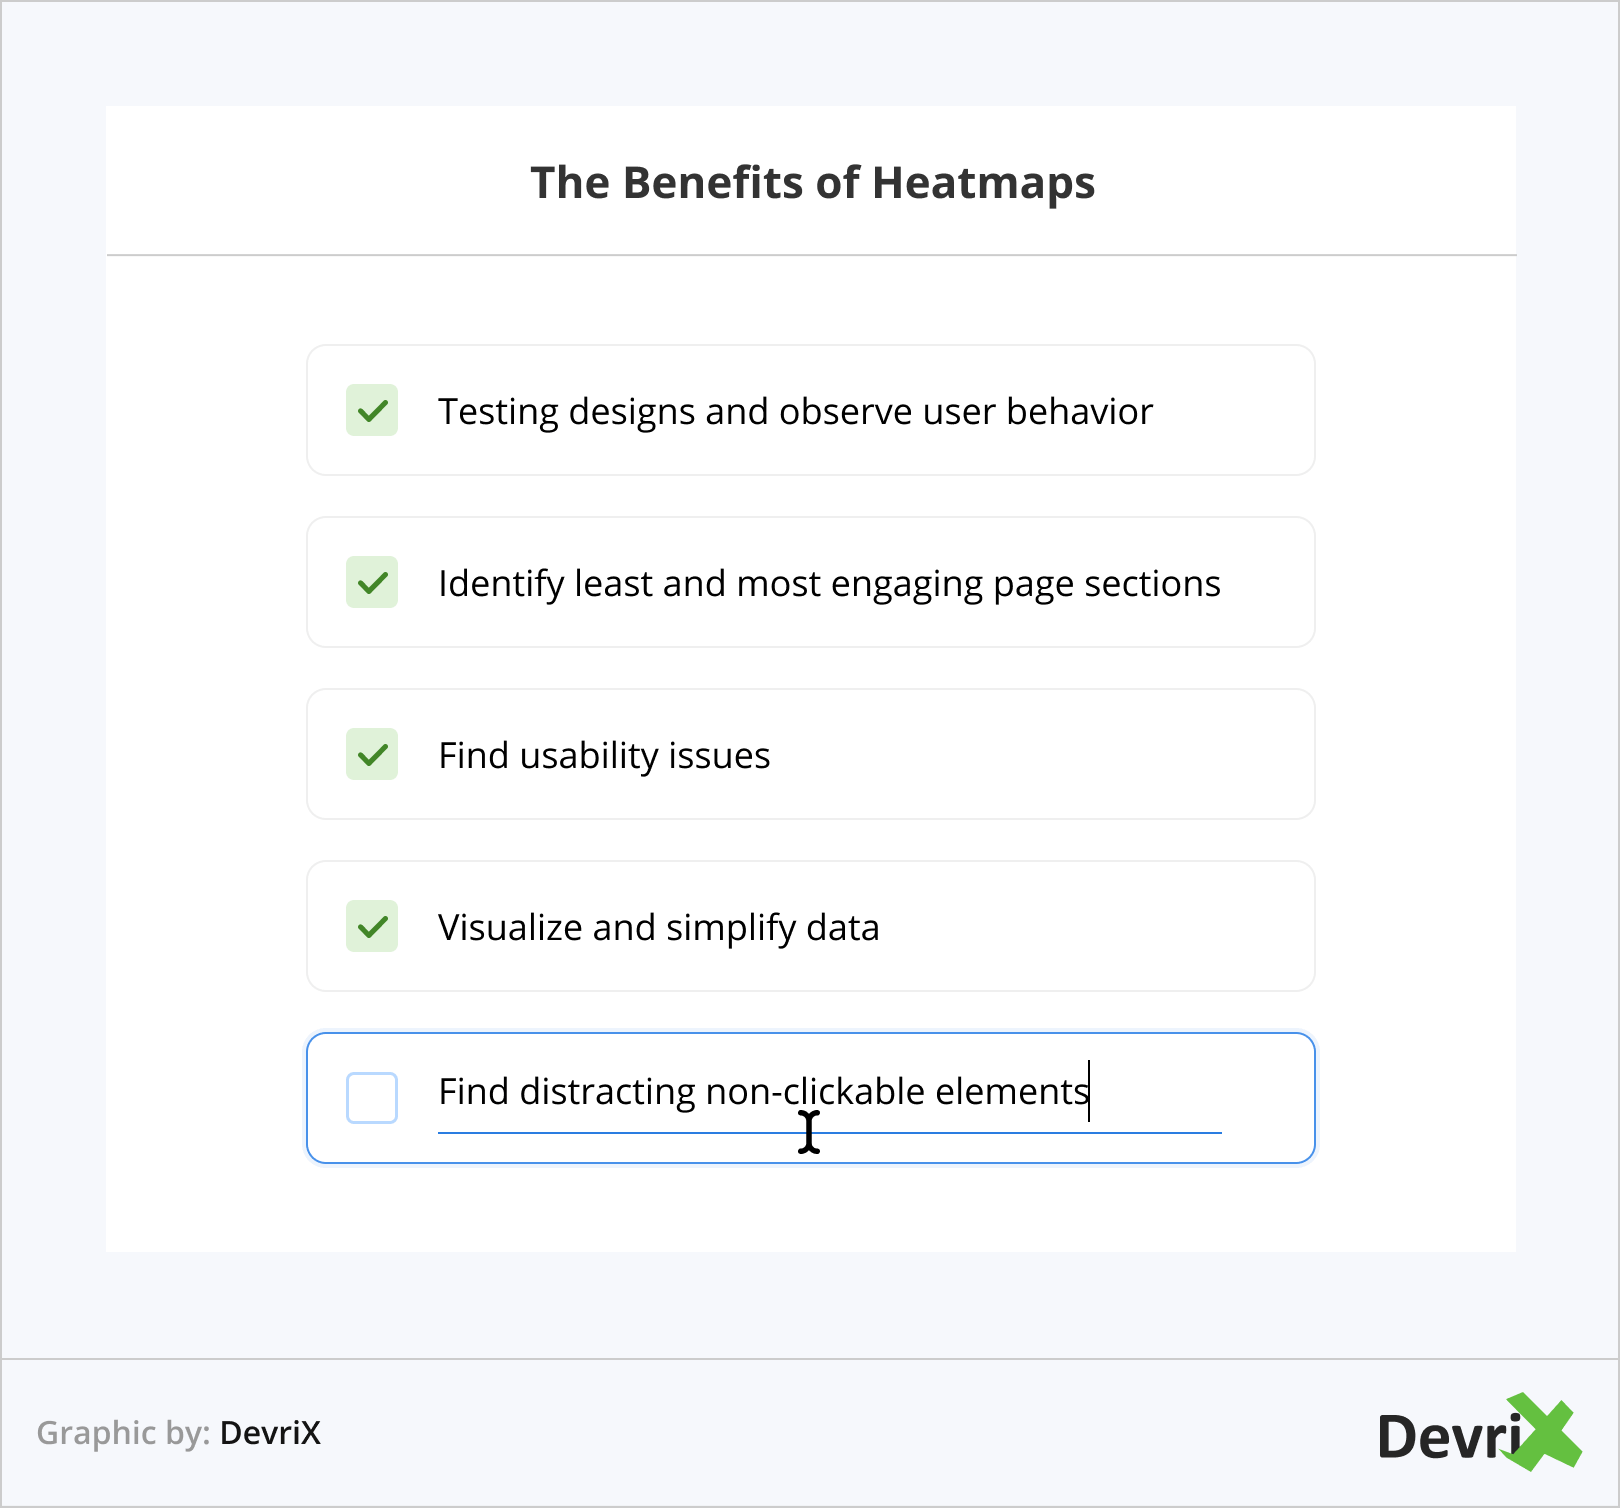
Heatmap analytics brings multiple benefits for marketers. They can help people in charge of websites to understand how users interact with the pages of their sites and find important answers.
In a nutshell, heatmaps enable marketing professionals to:
- Test different designs and see how they impact user behavior.
- Identify which sections of a page are most and least engaging.
- Discover usability issues on various pages.
- Visualize data such as clicks, scrolling, and eye movement.
- Find non-clickable page elements that distract users.
Readers Also Enjoy: What Are The Benefits of Big Data Analytics? – DevriX
Heatmap Software
There is an abundance of heatmap software you can choose from, each having its own specifications and limitations. You have Hotjar, which offers session recordings, Crazy Egg, specialized in conversion rate optimization, and Smartlook with its product analytics.
The list goes on and on, including tools like Lucky Orange, VWO, Contentsquare, Glassbox, and Mouseflow.
Readers Also Enjoy: Website Metrics That Matter [And You Should Track] – DevriX
Who Should Use Heat Maps?
Let us take a look at the professions that can benefit from heatmaps the most:
- Marketers. One of the main goals of marketing experts is to turn website visitors into customers. Therefore, it is crucial that they comprehend how visitors interact with pages, and whether they click on the designated areas – CTA’s, banner ads, featured products, etc.
- UX designers. User experience designers are responsible for providing the best possible experience to web visitors. Additionally, they have to make sure that users are finding the information they are looking for, and heat maps can give them such insights, making them a great tool for designers.
- Product managers. SaaS managers in particular can benefit from heat maps, since they can show them important information about user patterns. Optimizing these patterns can lead to more conversions, and higher revenue, and a lower churn rate.
- Data scientists. The great thing about heatmaps is that they can provide an easy-to-understand visualization of complex data. Since data scientists are in charge of gathering and analyzing information, and ultimately optimizing the processes of their company, heatmaps are invaluable tools.
Readers Also Enjoy: Customer Intelligence 101: Your Guide to Winning the Customer’s Heart – DevriX
When Should You Use Heat Maps?
As we’ve already established, a website heatmap can be very useful. Unfortunately, it is not the all-in-one solution for everything. There are specific situations where they work best:
- Website redesign. Redesigning your website can lead to a lot of positives for your business, such as increased traffic, more conversions, and higher click-through rates. Still, even after you’ve crafted a visually stunning website, people might not be clicking. A great way to understand what is happening is to use eye movement or movement maps to see what draws the attention of users.
- A/B testing. How do you know if it is better to place an element higher on the page, or if it’s better to use blue or red somewhere? Using a click map can help you see where users are clicking, and quickly figure out which options are better.
- Content. The attention span of users is short, so you need to structure your content well, be it blog posts, white papers, etc., so that people perform the desired action. Using scroll maps, you can see how much of your content is being read, and from thereon decide where is the best place to position your CTA button.
- Usability testing. It is always a bad sign if users are having trouble navigating through your website, and don’t find what they are looking for. With heat maps, you can see which areas of your site are confusing users, and make the necessary changes, so you can provide a better user interface, and experience.
Readers Also Enjoy: 11 Landing Page Optimization Tips to Try Today – DevriX
Key Takeaways
Heat mapping is a great way to visualize data, and understand how people interact with your pages. While they are not a universal answer to all your questions, heat maps can help you understand your audience as well as human behavior which in turn will undoubtedly lead to better business opportunities.
Team DevriX
This article is crafted by DevriX's seasoned marketing team, boasting over four decades of collective expertise in crafting sophisticated marketing funnels, devising comprehensive content frameworks and pillars, implementing engaging email campaigns, and creating impactful social media content designed for scalability.
Our marketing experts specialize in the complete spectrum of inbound marketing strategies. As an accredited HubSpot Agency Partner and a Semrush Partner, we engage in meticulous research, blending our extensive experience with the unique insights of our highly skilled team.
We set benchmarks in content creation by incorporating cutting-edge marketing trends, leveraging in-depth industry research, and utilizing state-of-the-art AI tools for data segmentation and captivating content hooks. Our proficiency extends across a diverse range of sectors, including working with SMEs, Fortune 1000 companies, global B2B brands, major publishing entities, WooCommerce platforms, business directories, and affiliate networks.